
The short answer
Autonomous mobile robot ROI in Birmingham, AL comes from the hours of floor transport, freight and material movement that a robot takes over from people, weighed against a fixed lease payment. The return is clearest on steady, route-based work with hours that are hard to fill, and thinner on irregular or sparse work. Savings are ranges set by a free site assessment, not a promise.
Key takeaways
- Returns come from measured route hours a robot takes over, not from a headcount cut alone.
- Use the government wage data on this page for the local wage for this job, not the metro average.
- Steady, route-based shifts with open or hard-to-fill hours usually show the clearest payback.
- Count staff check time, integration gaps and exceptions before you trust the savings range.
- A free site assessment turns the estimates on this page into a quote with a fixed lease payment.
Run the numbers for your site
Auto-detected from your location - we use the real BLS wage here. Not right? Pick your city or state above.
What do you want to automate?
The robot takes the repetitive cart and pallet moves off the heaviest motion.
What return can you expect from autonomous mobile robot ROI in Birmingham, AL?
Autonomous mobile robot ROI in Birmingham, AL comes from one thing: hours of repetitive floor and material work that a robot takes over, so the rest of the shift can be covered by the people you already have. The return is real only where those hours are steady, measured and recurring. A site with long, predictable routes and shifts that are hard to fill usually shows the clearest payback. A site with occasional or irregular moves sees a thinner return and a longer wait.
The national picture supports the category, though it does not size any one building. According to the National Safety Council summary of Bureau of Labor Statistics data, transportation and material moving accounted for 805,900 DART cases, or 27% of the total, in the 2023 to 2024 period. DART cases are days away from work, restricted work or job transfer cases. That figure describes the physical burden of this work, not robot adoption. On adoption, the A3 full-year 2025 figures report 36,766 industrial robots ordered in North America, up 6.6% in units, with collaborative robots at 19.6% of units. Those are industrial robot orders, and the coverage did not report separate counts for mobile robots.
The Bureau of Labor Statistics regional release for the Birmingham, AL metro, based on May 2024 OEWS data, reports pay across all occupations combined. That is a figure for everyone, not the row for this job. The government wage data panel on this page shows the local wage for this job, and that is the wage the savings range is priced on. This is why the page starts with hours: a metro average describes every worker, while a route describes only the work a robot can take.
Where does the labor for this work come from?
Most floor transport, freight and material movement at a site like this is done by people classed as laborers and freight, stock, and material movers, hand. According to the Bureau of Labor Statistics Occupational Outlook Handbook, that detailed occupation had 2,988,900 jobs in 2024. The broader hand laborers and material movers group is projected to grow 4% from 2024 to 2034. National growth does not tell you how hard the shift is to fill in your building, so the local hiring record matters more than the national trend.
Cleaning work draws on a separate pool. The same handbook lists 2,447,700 janitors and building cleaners in 2024, with projected growth of 2% from 2024 to 2034 and about 351,300 openings a year. Openings that large against the job count mean the work is posted often, which is what a site sees when it hires repeatedly for the same role.
Some sites also have people in other jobs who spend part of the shift on floor and material work. Those minutes matter, but the savings range is priced on the hours of laborers and freight, stock, and material movers, hand type of work. The calculator takes only those hours off the plate and leaves the rest of the other job's time where it is.
No verified source gave a typical number of people doing this work at one site of this kind of business, so this page does not state a headcount. The site assessment counts the people on the floor and the hours they spend on this work.
Median hourly wage, Laborers and Freight, Stock, and Material Movers, Hand
$4,174
Monthly cost of one full-time worker in Birmingham, AL, at the median wage plus payroll costs (an estimate, not a quote).
How does the savings math work?
The calculator works in hours first and then in money. The first input is the hours per week of laborers and freight, stock, and material movers, hand type of work on the site. The second is the share of those hours a robot can realistically take over. The third prices those hours at the local wage for this job from the government wage data on this page. The fourth subtracts the fixed lease payment, which is quoted after a free site assessment, and the staff time that still goes to checks, charging and exceptions.
Written out, the weekly range is roughly the hours taken over, valued at the local wage for this job, minus the lease cost and the retained staff time. Each input moves the range. The hours input is the one most often overstated, because a robot covers a route, not an entire role. Lease financing spreads the cost over the lease term, so payback is measured against the full lease and deployment terms in the quote, not against an upfront outlay.
Count the hours carefully. Time a route from the moment staff start it to the moment it is clear and checked. Split that time into what a robot could run alone and what still needs a person. Only the first part belongs in the hours taken over. Starting, checking and clearing routes is retained time and comes off the savings.
The table below shows how the hours split on a typical floor route. The robot figures come from one vendor-published case study, so your own timed walk should replace them.
- Night coverage
Autonomous Mobile Robot
Runs a fixed route on the same schedule each night without a driver
Staff
Needs shift scheduling and supervision, and open shifts leave gaps
- Consistency
Autonomous Mobile Robot
Same route, same passes, same order each time
Staff
Varies by worker, pace and attention
- Detail work
Autonomous Mobile Robot
Not suited to judgment calls on unknown messes or odd fixtures
Staff
Handles detail work, tight corners and judgment calls
- Exceptions
Autonomous Mobile Robot
Stops or waits when a route is blocked
Staff
Clears the obstacle and resumes the work
- Cost behavior
Autonomous Mobile Robot
Fixed lease payment for the term, plus staff time for checks
Staff
Pay follows hours and rises with overtime, turnover and training
- Flexibility
Autonomous Mobile Robot
Best on repeated routes with clear layouts
Staff
Moves between tasks as the day changes
What changes the number up or down?
Five factors move the range most. Route length and layout set how many hours a robot can cover in a shift. Shift timing matters because off-peak routes avoid crowds and let the robot run with fewer people in the aisles. Open shifts and turnover raise the value of hours a robot can cover without a new hire. Integration needs, such as doors, elevators and network coverage, add setup time and can leave a unit idle. The lease term and the size of the fleet set the fixed side of the math.
The direction matters. A longer, clearer route and a steady shift push the range up. Tight layouts, frequent blockages and irregular shifts push it down. A site with many short routes may need several stops per cycle, which lowers the share of time a unit can run without a person.
The checklist below lists what to verify before you trust a range, including the items that most often change it.
What are the risks to the return, and how do you avoid them?
The most common risk is overstating hours. A plan built on the full shift rather than the robot's route will show a return that does not arrive. The second is underestimating staff time for checks, route starts, charging and exception handling. The third is a unit that sits idle because of a layout problem or a network gap found only after installation. Each of these can be found before signing by timing the route and checking the building.
Safety is a separate reason to look at this work carefully. The National Safety Council summary reports 805,900 DART cases for transportation and material moving, 27% of the total, in 2023 to 2024. Safety and Health Magazine, citing Bureau of Labor Statistics data, reports 1,391 fatalities in transportation and material moving in 2024, down 7.5% from 1,495 in 2023, with a fatality rate of 12.5 per 100,000 full-time equivalent workers, down from 13.6.
These are whole-group figures. This research did not find an independent study of how much a robot lowers injury rates in a building like yours, so do not count safety gains in the savings range unless your own incident records support it.
How much does turnover add to the return?
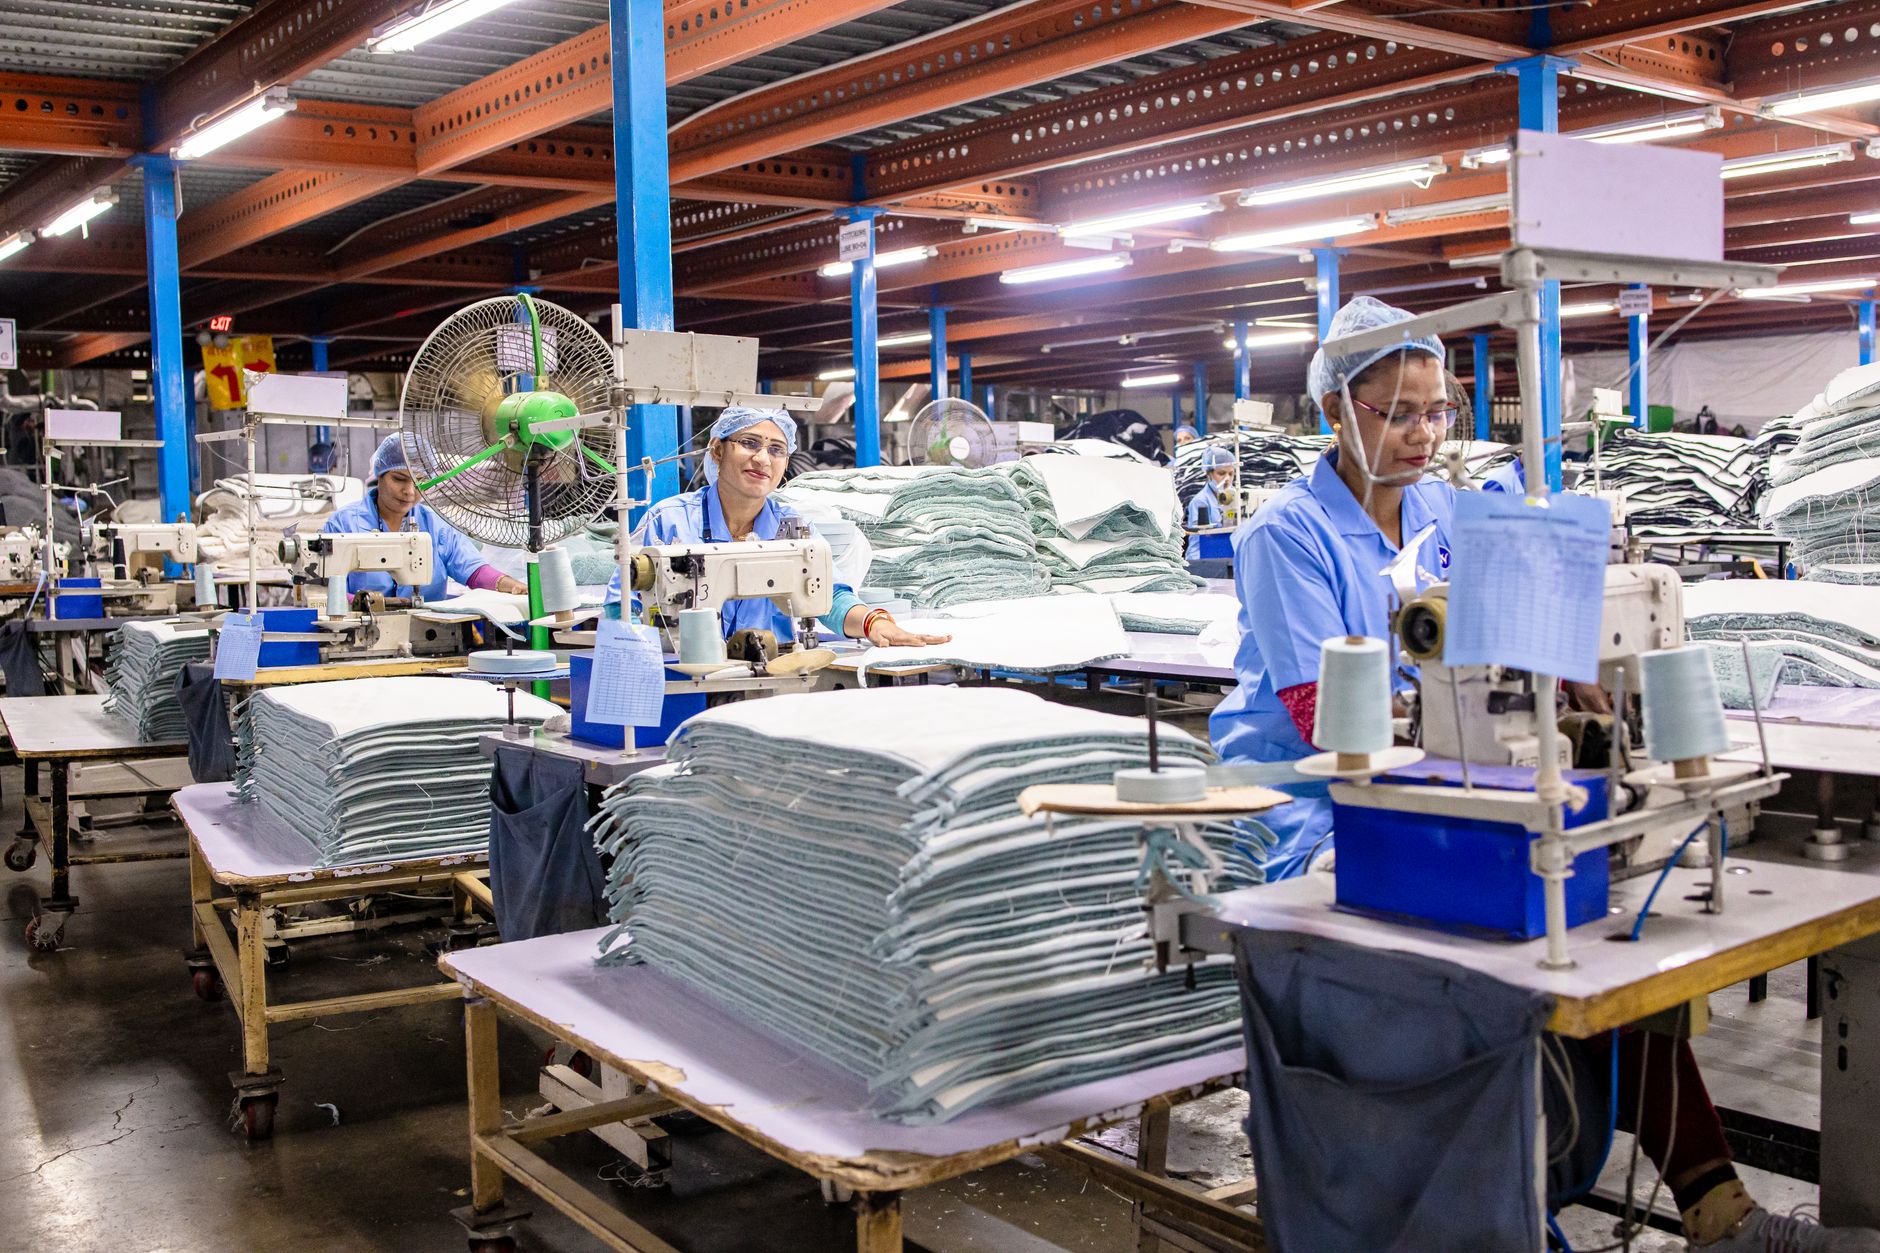
Turnover raises the value of covered hours, because each open shift has to be filled, trained and covered again. A secondary compilation of warehouse labor statistics reports a 49% turnover rate and attributes it to 2023 BLS data. The original BLS table was not confirmed in this review, so treat the figure as a rough signal, not a measured rate for your site. No authoritative 2025 national turnover figure for laborers or janitors was found.
Your own records are the better input. Count separations and open shifts for the job over the last year, and count the hours those gaps pushed onto supervisors or other staff. That number belongs in the calculator, because those are hours a robot can cover without a hire.
Training and support also cost time. Each new hire needs a walk of the route and a period of supervision, and that effort recurs with every separation. The plan should show who trains new people and who answers when a unit needs service, so the time saved on routes is not lost to onboarding.
What is a realistic timeline from assessment to payback?
A typical path runs in phases. First, a site assessment maps the floor, measures the task hours and identifies doors, elevators and network gaps. Second, the lease and deployment plan is quoted with a fixed lease payment. Third, the robot is installed and integrated, staff are trained, and go-live support covers the first runs. Fourth, the team reviews measured hours against the range and adjusts routes. Payback then depends on how many of the modeled hours the robot actually takes over.
This page does not give a verified month count for a Birmingham site, because no source for that setting was found. Payback starts when measured hours taken over, valued at the local wage for this job, cover the lease and the retained staff time. A sound way to test it is to start with one unit on the highest-hour route, measure across a full cycle of the work, and widen the fleet only if the numbers hold.
How do I get a precise figure from a free site assessment?
A free site assessment replaces the estimates on this page with your numbers. Bring the shift schedule, the route list or the floor area if you have it, your open-shift and turnover records for the job, and any notes on doors, elevators and network coverage. The assessment maps the floor, times the hours of this kind of work and marks where a robot can run without help.
We are a US commercial robot integrator. We match the robot to the site, lease it through financing, deploy and integrate it, train staff and service it nationwide. The lease payment comes in a quote after the assessment, and it is fixed for the term. Ask for the quote to show the hours assumed, the share of work taken over and the staff time kept, so you can check the range yourself.
Frequently asked questions
Put a robot to work in Birmingham.
We walk your site, learn the job, and recommend the unit that fits. Then we quote the lease, deploy it, and keep it serviced.
Sources
- US Bureau of Labor Statistics, Occupational Employment and Wage Statistics (OEWS May 2024)
- Bureau of Labor Statistics, Occupational Outlook Handbook: Hand laborers and material movers
- Bureau of Labor Statistics, Occupational Outlook Handbook: Janitors and building cleaners
- Bureau of Labor Statistics, Birmingham, AL occupational employment and wages, May 2024
- National Safety Council, injury facts (summary of BLS data)
- Safety and Health Magazine, fatal injuries summary citing BLS data
- Automate (A3), robot orders grow 6.6 percent in 2025
- Opensend, warehouse turnover rate statistics (secondary source, unverified original)