
The short answer
Autonomous mobile robot ROI in Boston, MA comes from taking repetitive transport work off laborer shifts, such as moving pallets and carts along fixed routes. The return is a range, not a promise: it grows with the share of routes the robot runs reliably and the number of shifts it covers, and it shrinks when utilization is low, layouts change often, or the lease payment outweighs the hours saved. A free site assessment turns that range into a figure for one building.
Key takeaways
- Autonomous mobile robot ROI in Boston depends on covered transport hours, weighed against the lease payment.
- Route work with a fixed start and end point is where the return is most reliable.
- The savings range moves with the share of routes the robot runs and the shifts it covers.
- A free site assessment turns the range into a quote and a measured payback date.
Run the numbers for your site
Auto-detected from your location - we use the real BLS wage here. Not right? Pick your city or state above.
What do you want to automate?
The robot takes the repetitive cart and pallet moves off the heaviest motion.
What return can a business in Boston expect from an autonomous mobile robot?
Autonomous mobile robot ROI in Boston is a comparison of two costs. The first is the labor the robot takes over, meaning the hours of transport work that Laborers and Freight, Stock, and Material Movers, Hand would otherwise do on each shift. The second is the fixed lease payment for the robot, quoted after a site assessment, plus the service coverage that keeps it running. When the covered hours are worth more than the lease, the robot pays back. When they are not, it does not, which is why the range matters more than any single figure.
The government wage data on this page gives the local wage for this job in Boston. The savings range is priced on that wage, so a higher local wage raises the value of each covered hour. The wage is only one input. How much of the shift the robot can actually run often moves the result as much as the wage does, and that is the part a site assessment measures.
We pick the robot for the site, lease it through financing, deploy and integrate it, train the staff and service it nationwide. That matters for the return because the range you model is tied to a robot mapped to your floor, not to a generic figure from a brochure.
Where does the return come from in a Boston facility?
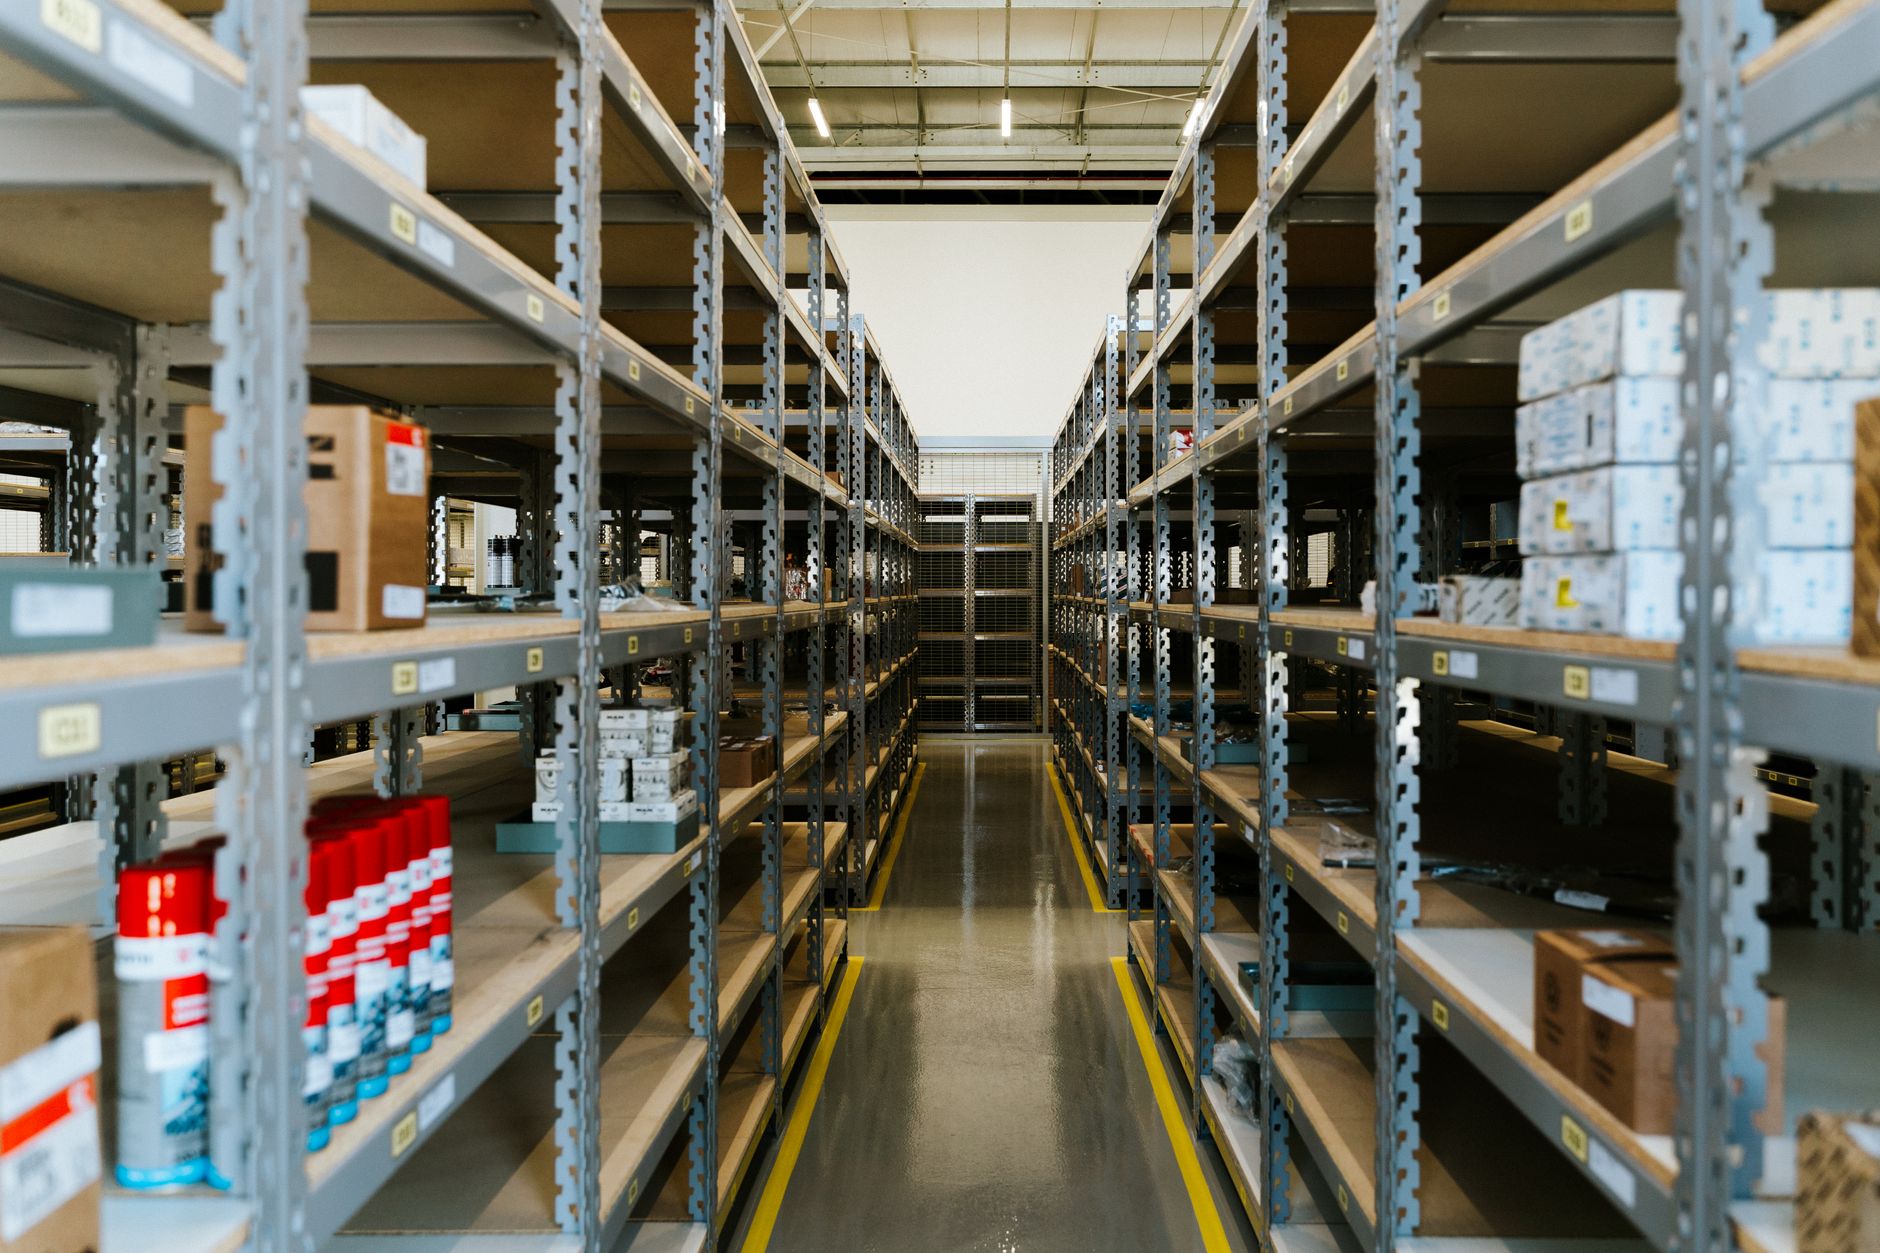
Most of the return sits in the aisles and at the docks, not in one dramatic task. Transport work is steady and repetitive: receiving pallets to storage, carrying cartons from pick zones to staging, and returning empty carts. Repetition is what makes automation fit, because the route is known, the load is predictable, and the same path repeats every shift.
The size of the pool is a national figure. According to the U.S. Bureau of Labor Statistics Occupational Outlook Handbook, the hand laborers and material movers group held about 6,950,000 jobs in 2024, and Laborers and Freight, Stock, and Material Movers, Hand accounted for 2,988,900 of them. The same source projects a change of 258,400 jobs for 2024 to 2034, which it describes as growth of 4 percent, as fast as average.
The BLS Industries at a Glance page for warehousing and storage reports about 1,767 thousand employees in that industry in December 2023, seasonally adjusted. Adoption is also rising. According to IFR World Robotics 2026, as reported by Supply Chain 247, transportation and logistics was 47 percent of professional service robot sales worldwide in 2025, with 117,500 units, up 21 percent. That figure comes from a sample of 238 of 1,001 manufacturers and is not projected to the whole industry, so treat it as a direction, not a local measure.
A growing occupation means the work itself is not disappearing, so the decision is about which hours to automate, not whether the work exists. We did not verify a Boston-specific employment count for this page, so we do not state one. The site assessment counts the actual roster and shifts in your building.
Median hourly wage, Laborers and Freight, Stock, and Material Movers, Hand
$5,127
Monthly cost of one full-time worker in Boston, MA, at the median wage plus payroll costs (an estimate, not a quote).
Which tasks can an autonomous mobile robot take over?
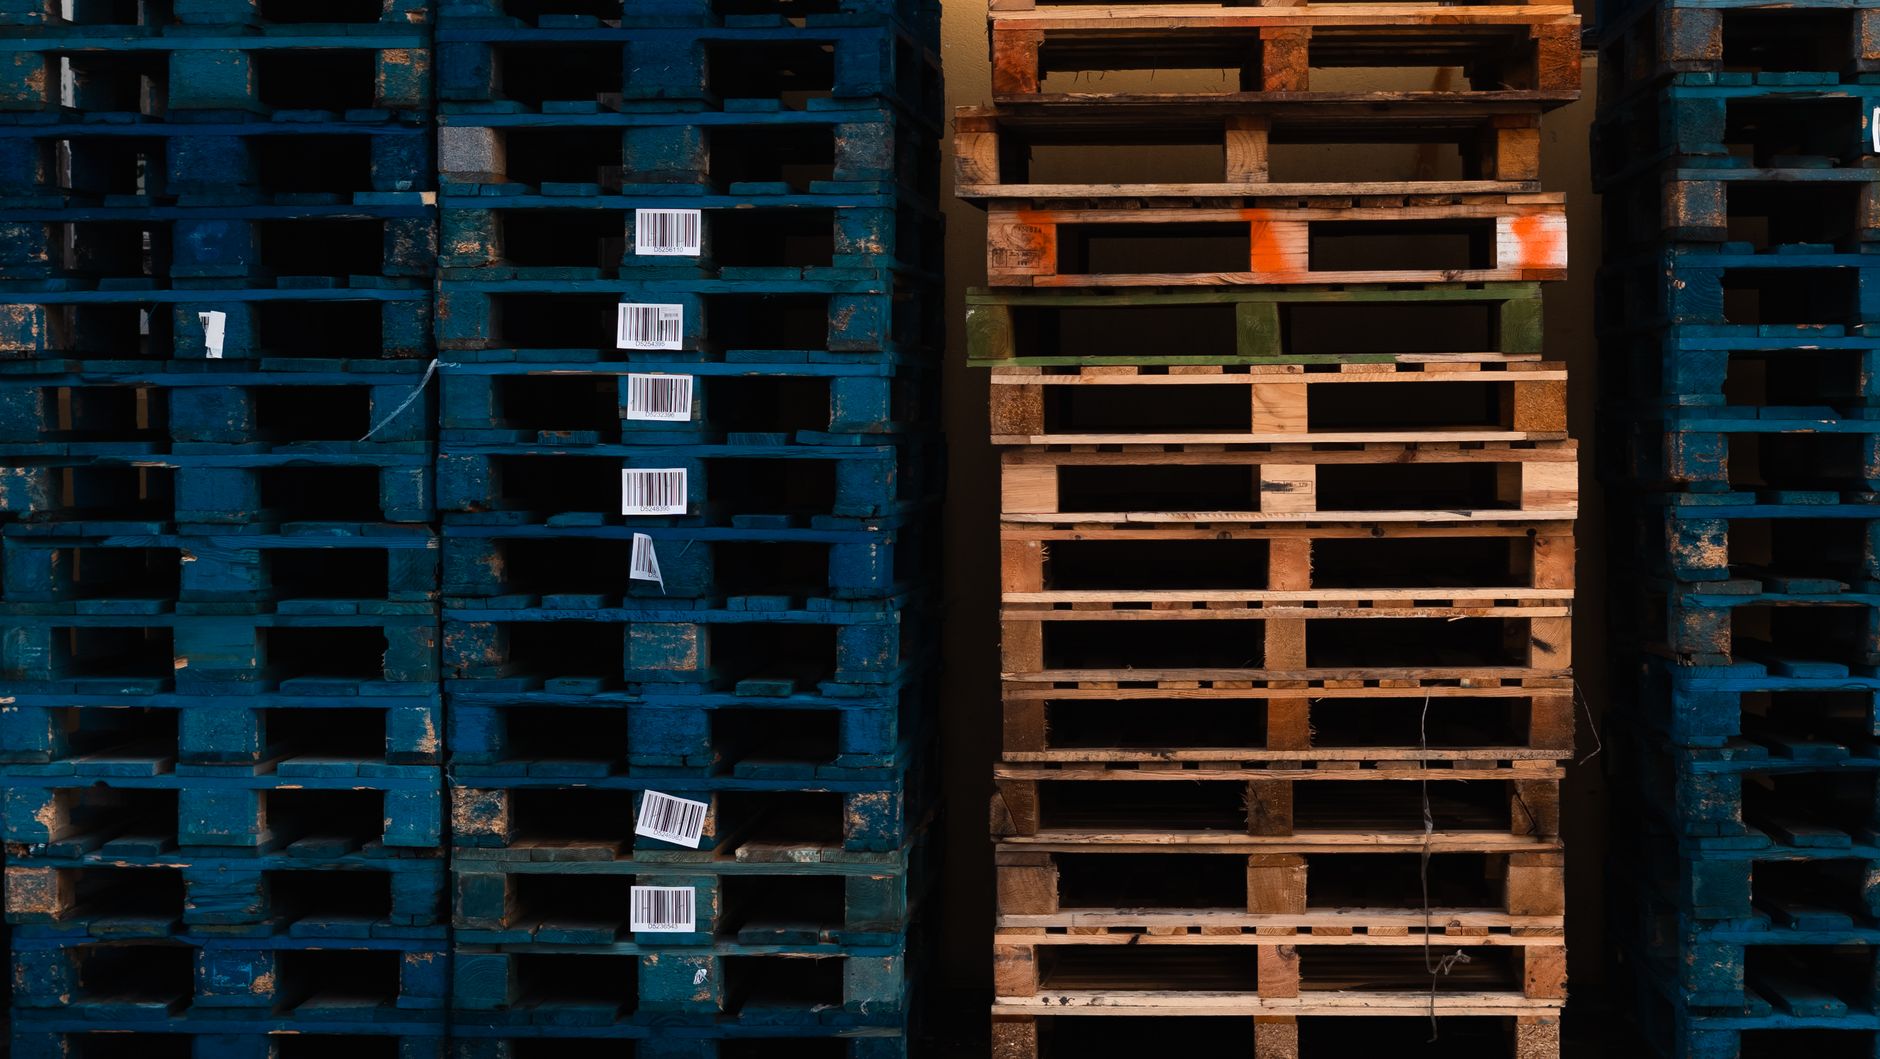
The robot takes route work. It is strongest when a task has a fixed start point, a fixed end point and a repeatable path through the building. Pallet moves between a receiving door and racked storage, and tote runs from a pick zone to a packing line, are typical examples. Cart and cage moves on set loops fit the same pattern.
Tasks that need judgment fit less well. Loading a mixed trailer, handling damaged goods, or clearing a blocked aisle still need a person. Those tasks stay with staff, and the time the robot frees up goes toward them. This is why the share of work a robot takes is a partial share of routes, not the whole shift.
Some sites add a second task, such as overnight floor care with a warehouse cleaning robot. That is a separate lease decision with its own hours, and it should be modeled on its own rather than added to the transport figure.
How does the payback math work?
The core formula is simple. Take the hours per shift the robot runs on routes it covers, multiply by the number of shifts per year it runs, and price those hours at the local wage for Laborers and Freight, Stock, and Material Movers, Hand from the government wage data on this page. That gives the labor value of the offset. Subtract the annual lease cost, including service coverage, and the result is the net return for the year.
Two inputs are usually misjudged. The first is the share of hours the robot actually runs on its routes, because staff still handle the remainder. The second is shift count. A robot that covers a single shift returns less than one that covers several, since each added shift adds covered hours against the same robot.
Payback is the point where cumulative net return turns positive. The range the calculator shows is built from a low case and a high case for covered hours, not a single expected value. Treat it as a planning range and confirm it against measured route data from the assessment. We use 4 people as a planning assumption for the number doing this work at one site. That is an analyst assumption, not a verified finding, and the assessment replaces it with your real roster.
What raises or lowers the number?
The biggest upward driver is utilization, meaning how many covered hours the robot runs in each shift. A robot that stays busy across the shift returns more than one that waits between requests. Route length, traffic in shared aisles, and the number of stops per cycle all shape that figure.
Wage level sets the value of each hour, so higher local wage cost raises the value of the same covered hours. Turnover also matters. According to CleanLink, citing the BLS Job Openings and Labor Turnover Survey for 2025, all-industry voluntary turnover ran about 17 to 20 percent. That figure is not specific to this job, but churn means training time keeps recurring, and a robot route does not change when a worker leaves.
Layout changes push the number down. Frequent rack moves, new doors and floor alterations all require remapping, and each change takes time away from covered hours. Work through the checklist below before accepting any range.
Is a robot better than staff for this work?
The robot and the person do separate parts of the same job, so the question is which tasks each does best. The robot is consistent on a fixed route, runs through long stretches without a break, and does not drift off route at the end of a shift. The person handles what changes from hour to hour.
Staff keep the advantage wherever a route is interrupted by people, pallets out of position, or decisions about what to move first. A plan that removes people from the floor entirely usually underestimates exceptions. Our deployments assume staff stay on the floor for exceptions and loading.
We train the staff on dispatch, exception handling and basic recovery, so the people who remain know what to do when a route stops. That training is part of the deployment, not an afterthought.
- Fixed route all shift
Autonomous Mobile Robot
Runs the same path with the same stops each cycle
Staff
Consistent at first, then slows with fatigue and breaks
- Blocked aisle or obstacle
Autonomous Mobile Robot
Stops and waits for clearance or a reroute
Staff
Clears the blockage or reroutes on the spot
- Mixed or irregular loads
Autonomous Mobile Robot
Poor fit when load shape changes on every trip
Staff
Handles mixed freight and judgment calls well
- Unattended hours
Autonomous Mobile Robot
Runs on schedule once the route is mapped and charged
Staff
Needs a scheduled shift and coverage for breaks
- Changing priorities mid-shift
Autonomous Mobile Robot
Follows the queue it is given
Staff
Reorders work as the floor changes
- Staff turnover
Autonomous Mobile Robot
Route is unaffected when a worker leaves
Staff
Needs onboarding and time to reach full pace
- Layout change
Autonomous Mobile Robot
Needs remapping after major layout changes
Staff
Adapts to a new layout with a short briefing
What are the risks to the return and how do you avoid them?
The most common risk is paying for coverage the floor cannot use. A robot that runs a route with frequent blockages or narrow passages returns less than the plan assumed. Measure the route in the assessment, and start with one leased unit in a phased deployment that does not shut the building down.
Downtime is the second risk. When one robot is down, its route waits. Ask about remote triage, on-site dispatch and spare unit coverage before signing, and confirm what the maintenance service plan covers. A backup plan keeps one failure from erasing the week's covered hours.
Transport is also where injury exposure concentrates. According to the National Safety Council, which summarizes BLS data for 2023 to 2024, transportation and material moving accounted for 468,830 days-away-from-work cases, about 26 percent of the total. A robot lowers that exposure only where it takes over the work and the site is laid out so people and routes do not cross unplanned. Layout review is part of the assessment for that reason.
What is a realistic timeline from assessment to payback?
Start with the free site assessment. It maps the floor, measures routes, counts the hours the robot could cover and sets the lease payment in a quote. The quote is issued after the assessment, not before, so the figures rest on your building. From there the sequence is consistent: quote, financing, deployment and integration, staff training, then go live support.
A phased deployment usually begins with one leased unit on the highest volume route. Staff run it alongside the existing process, the measured route data is compared against the assessment, and additional units follow only if the measured hours support them. This avoids committing to a fleet before the first route has proven its share.
Payback arrives when cumulative net return turns positive. For one route, that depends on when the robot reaches its measured utilization, which can take longer than the first week after go live. Let the measured data set the date rather than a projection.
How do you get an exact figure from a free site assessment?
The assessment turns the range into a figure for one building. We walk the floor, record routes and stops, measure aisle widths and level changes, and confirm the shifts you want covered. Bring your shift schedule, your staffing roster and any layout plans you have.
The output is a quote with a fixed lease payment, financing terms and a range of covered hours with the assumptions written out. Ask for the assumptions in writing, especially the share of routes the robot takes and the shift count, because those two drive the result. The lease payment is set in the quote, after the assessment.
Local context enters through the government wage data on this page, which gives the wage for this job in Boston. The assessment ties that wage to your actual roster and hours. One partner handles deployment, service and dispatch, so the team that assessed the floor also supports the robot after go live.
Frequently asked questions
Put a robot to work in Boston.
We walk your site, learn the job, and recommend the unit that fits. Then we quote the lease, deploy it, and keep it serviced.
Sources
- US Bureau of Labor Statistics, Occupational Employment and Wage Statistics (OEWS May 2024)
- BLS Occupational Outlook Handbook: Hand Laborers and Material Movers
- BLS Industries at a Glance: Warehousing and Storage (NAICS 493)
- BLS Census of Fatal Occupational Injuries, 2024
- National Safety Council injury facts (BLS summary)
- CleanLink, janitorial turnover article
- Supply Chain 247, IFR World Robotics 2026 coverage