
The short answer
Autonomous mobile robot ROI in Knoxville comes from the repetitive transport and floor care hours a site now pays people to do, priced at the local wage for laborers and freight, stock, and material movers, hand. The savings range is that labor offset, reduced by the share of the work a robot can realistically take and by the fixed lease payment and supervision time it adds back. A precise range needs measured hours from your own floor, which a free site assessment provides.
Key takeaways
- The return comes from route-based hours moved off paid shifts, not from a headcount target.
- Only the share of work a robot realistically takes counts toward savings.
- Lease cost and supervision time must be netted against the labor offset every time.
- Government wage data frames the labor side, but Knoxville site figures must come from your own measurements.
- A free site assessment turns the range into a lease quote and a measured payback plan.
Run the numbers for your site
Auto-detected from your location - we use the real BLS wage here. Not right? Pick your city or state above.
What do you want to automate?
The robot takes the repetitive cart and pallet moves off the heaviest motion.
Autonomous Mobile Robot ROI in Knoxville: What to Expect
Autonomous mobile robot ROI in Knoxville is a question about hours, not headlines. A robot earns its place when it takes repetitive moving or floor work off shifts that people are otherwise paid to cover. The return is the value of those hours, minus what the robot costs to lease, supervise and keep running.
This research did not turn up verified Knoxville warehouse employment, turnover or incident figures, so the local input on this page is the government wage data panel. It shows the local wage for laborers and freight, stock, and material movers, hand. The other figures here are national, and each one is named where it appears. Check the savings range against your own site numbers before anyone signs off.
Sites with the most route work and the hardest time filling shifts tend to show the clearest case. Sites with mostly varied picking and irregular loads usually show a smaller one.
Where does the labor saving come from in a Knoxville warehouse?
Warehousing is a large employer of this kind of work. According to the Bureau of Labor Statistics Occupational Outlook Handbook, the broader hand laborers and material movers group held about 7.0 million jobs in 2024, and the detailed occupation Laborers and freight, stock, and material movers, hand accounts for 2,988,900 of them. That detailed occupation is the one priced in this calculator.
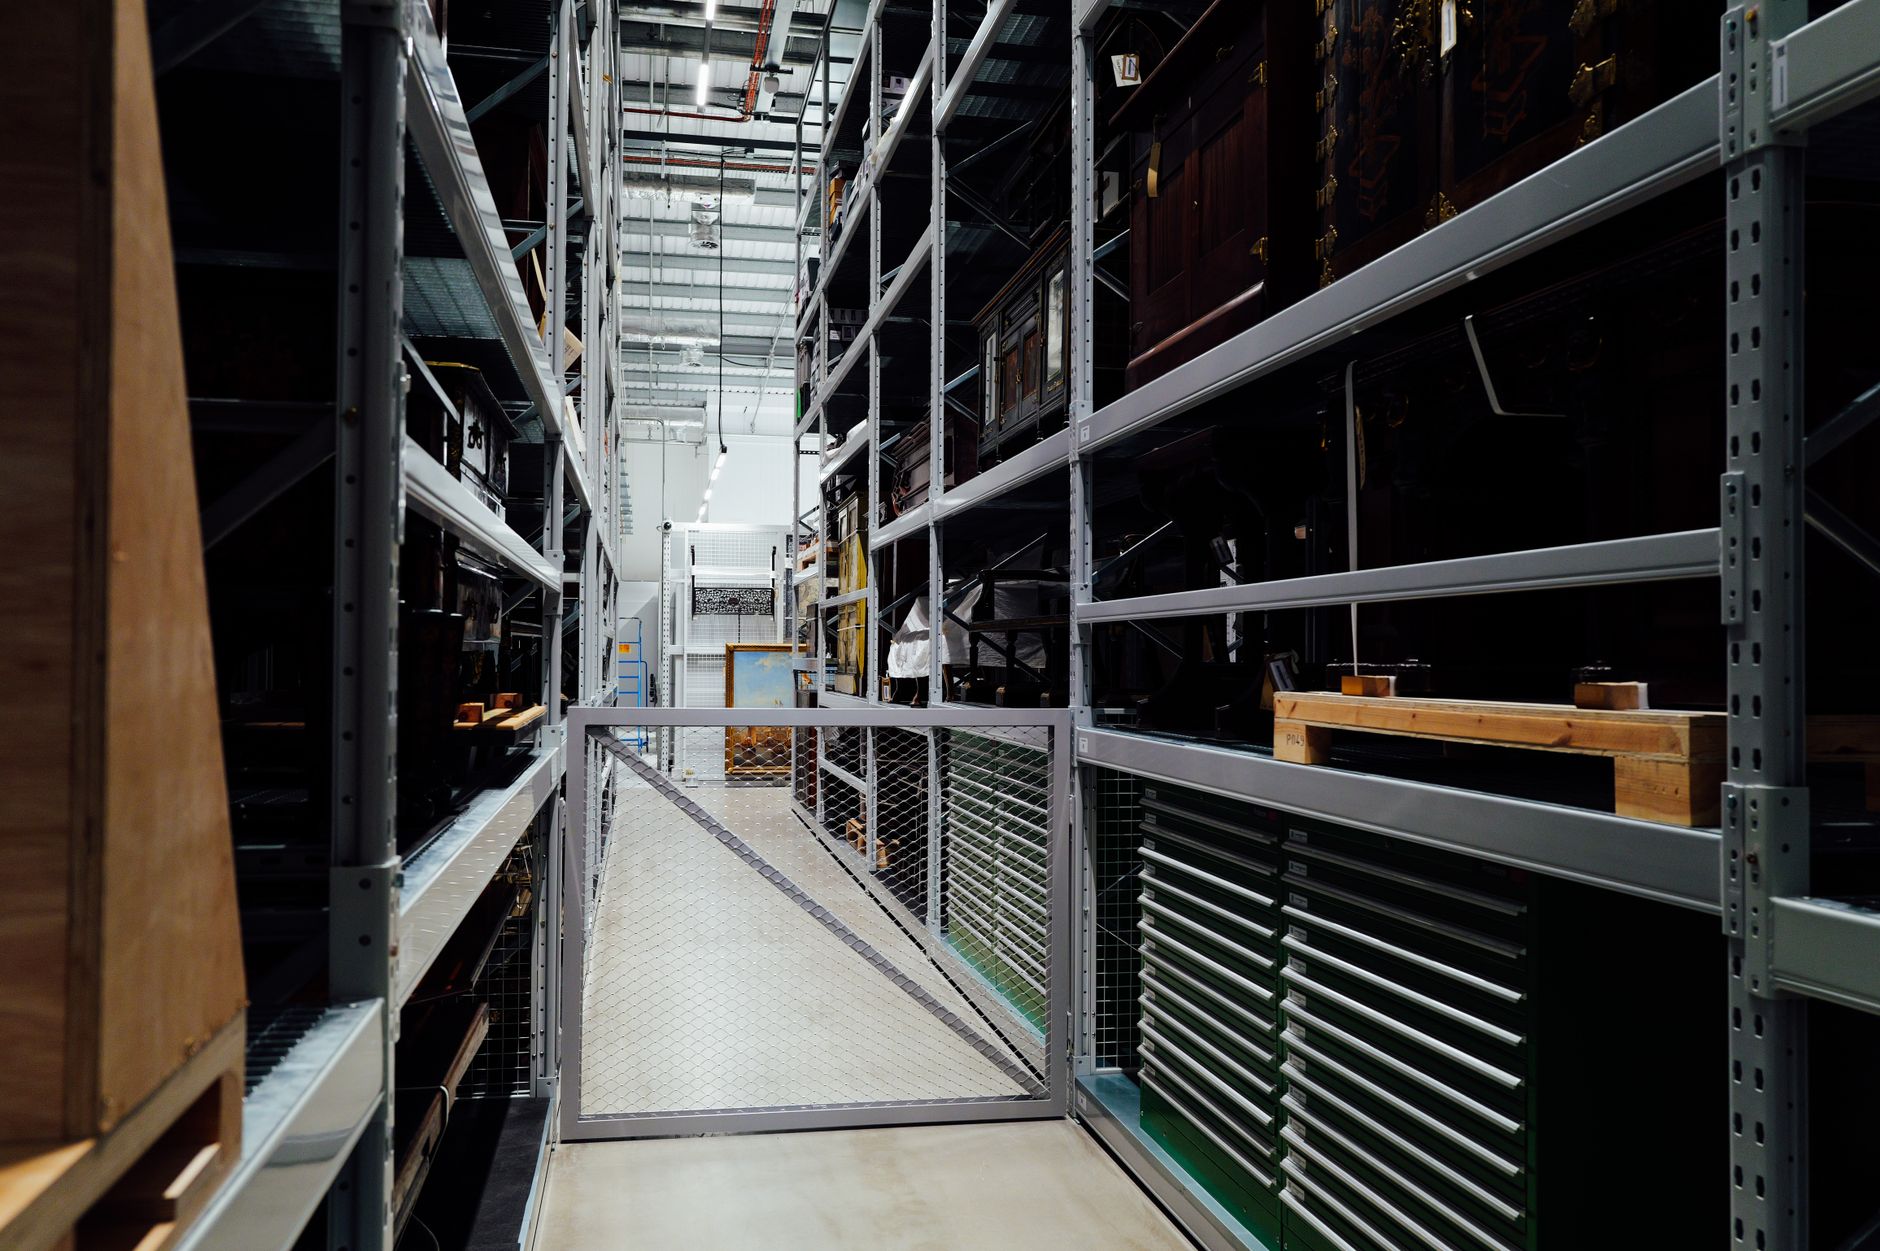
At one building, the saving usually sits in three places. The first is pallet and tote moves between the dock, staging and racking. The second is scheduled scrubbing of main aisles. The third is long repeat trips that pull a person away from the work only they can do. The offset counts the hours of those tasks, not every hour the site runs.
Time spent waiting for a loaded cart, or walking back to a station for the next move, is easy to miss in a headcount. A timed walk-through over several shifts is the simplest way to find it.
Median hourly wage, Laborers and Freight, Stock, and Material Movers, Hand
$4,186
Monthly cost of one full-time worker in Knoxville, TN, at the median wage plus payroll costs (an estimate, not a quote).
How is the payback math worked out?
The calculator works in four steps. It takes the weekly hours of route-based work the site can hand to a robot, multiplies them by the local wage for the job from the panel, and scales the result by the share of those hours a robot can realistically take. That gives the gross labor offset.
It then subtracts the fixed robot lease payment, which is quoted after a site assessment, and the supervision time people still spend on exceptions, charging, dock handoffs and map updates. For the worked example we assume four people do this kind of material movement at one mid-size site. No verified per-site headcount was found, so treat four as a planning assumption rather than a published count.
Each input is a range, so the result is a range. Savings are never a single promised number, and a change in any one input moves the whole estimate.
How much of the work does a robot realistically take?
Robots take the parts of a job that repeat on a fixed route across a flat floor. Straight aisle runs, scheduled scrubbing and transport between defined points are strong candidates. Picking from varied racking, unstacking mixed loads and handling damaged freight usually stay with people.
Most sites find the share a robot takes is smaller than the hours that sound like the job. A realistic planning share is the predictable part of the route work, with the exception cases removed. Measure it over several shifts rather than estimating from a single walk through the building.
Do not take the share from a vendor demonstration route, which is usually clean and short. Your floor has pallets left in lanes, forklifts crossing aisles and a dock that changes by the hour.
What changes the number up or down?
Three inputs move the result most: the hours of route work, the share of those hours that is predictable, and the supervision time added back. Turnover matters too, but it is hard to pin to one figure. The 2019 IARW Warehouse Facility Labor Turnover Survey reported an average labor turnover rate of 32.5% for the year ending December 2018, while vendor and blog estimates vary far more widely, so measure your own open shifts over the past year.
Open shifts raise the value of a robot, because it covers scheduled hours without a hire. Layout changes lower it, because each rack move can call for a new map and new routes. Seasonal peaks help if the fleet can add hours, and they hurt if they bring new exceptions into the aisles.
The checklist below lists what to confirm before you use the calculator.
What are the risks to the return, and how do you avoid them?
The main risk is downtime. A robot that waits on charging, is blocked by a pallet left in a lane, or runs on an outdated map covers fewer hours than the calculator assumed. Plan the charging location, set clear lane rules for staff, and schedule map updates whenever racking changes.
The second risk is safety scope. According to the Bureau of Labor Statistics, warehousing and storage had a 2024 total recordable case rate of 4.8 per 100 full-time workers, a DART rate of 4.1, and 1.5 days-away cases per 100 full-time workers. Fatalities rose to 32 in the 2024 data, up from 28. A robot can reduce exposure on the tasks it takes, but the rest of the operation keeps its own risk.
Choose the baseline with care. An advocacy report from February 2024 cites a national warehouse injury rate of 5.7 per 100 FTE, which does not match the Bureau of Labor Statistics figure. Use the government series as the baseline, and state which source you used in any internal report.
How fast does payback happen? A realistic timeline
Payback follows the sequence of the deployment. The site assessment comes first, then floor and route mapping, then a pilot on one or more units, then go-live support with the staff who work beside the fleet, and finally a review of measured hours against the baseline. Each step needs a decision, so the timeline depends on how fast your team can release floor space and confirm scope.
Do not judge payback from the first week. Early runs include route tuning, dock rule changes and staff learning the exception process. Compare measured hours after the pilot with the assessment baseline, and only then test the return against the lease.
A single leased unit is a common way to start, because it shows how much route work the floor really has before the fleet is sized.
Robot or person? Where each one wins
A robot is consistent and available on scheduled hours, while people are better at judgment and irregular work. The useful question is which tasks a robot takes so people spend their time on the rest. The comparison below is point by point, and people win in several rows.
Neither option is free of cost. A robot brings a fixed lease payment, service visits and supervision time. Staff bring wages, benefits, scheduling and the cost of open shifts. An honest comparison uses the same hours on both sides.
- Scheduled route work
Autonomous Mobile Robot
Same path and pace on every run
Staff
Varies with fatigue and the length of the shift
- Night coverage
Autonomous Mobile Robot
Runs scheduled hours without hiring for them
Staff
Depends on filling the shift
- Unplanned obstacles
Autonomous Mobile Robot
Needs clear lanes and stops or alerts when blocked
Staff
Clears the blockage and keeps working
- Mixed or damaged loads
Autonomous Mobile Robot
Weak on varied loads and damaged freight
Staff
Handles judgment calls on loads
- Changing the layout
Autonomous Mobile Robot
Needs remapping and new routes
Staff
Adapts on the spot
- Cost structure
Autonomous Mobile Robot
Fixed lease payment plus service and supervision time
Staff
Wages, benefits, scheduling and turnover cost
What does adoption data say about warehouse robots?
National data shows the direction. According to the International Federation of Robotics, transportation and logistics accounted for 52% of professional service robots in use, a share the IFR largely attributes to staff shortages, as reported by Forklift Action. The IFR also reported in a press release that global sales of professional service robots for transport and logistics rose 21% to 117,500 units in 2025.
On the factory side, an IFR-based report says US industrial robot installations rose 12% to 38,400 in 2025, with food, warehousing and logistics as drivers. A preliminary IFR release gave 38,000 units, so the figures vary by source and date. Globally, industrial robot installations rose 11% to 603,000 units in 2025.
Scale helps frame the segment too. Census County Business Patterns data, reported in a 2016 news story, counted 362 US warehousing and storage businesses with 500 or more employees. That count is dated, so use it only to show the size of the segment.
How do you get a precise figure from a free site assessment?
Bring your measured hours, shift pattern, floor plan and turnover history to the free site assessment. We map the floor, identify the route work a robot can take, and separate it from the exception work that stays with staff. The output is a savings range built from your numbers, plus a fixed robot lease payment quoted for the scope we recommend.
We choose the robot for the site, lease it through financing, deploy and integrate it, train the staff who work beside it, and service it nationwide. One partner handles deployment and service calls, so there is one point of contact from assessment through go-live and after.
Ask during the assessment what backup coverage and repair response are included. Downtime belongs in the return you model, so a range that ignores it is not a usable range.
Frequently asked questions
Put a robot to work in Knoxville.
We walk your site, learn the job, and recommend the unit that fits. Then we quote the lease, deploy it, and keep it serviced.
Sources
- US Bureau of Labor Statistics, Occupational Employment and Wage Statistics (OEWS May 2024)
- U.S. Bureau of Labor Statistics, Warehousing and Storage (NAICS 493) injury and illness data
- U.S. Bureau of Labor Statistics, Occupational Outlook Handbook: Hand laborers and material movers
- Forklift Action, reporting International Federation of Robotics service robot data
- International Federation of Robotics press release via Business Wire
- Manufacturing Digital, reporting International Federation of Robotics data
- International Federation of Robotics, preliminary figures 2024 and trends 2025
- National Employment Law Project, The Human Toll (February 2024)
- News report of Census County Business Patterns, warehousing and storage businesses with 500 or more employees (2016)