
The short answer
Autonomous mobile robot ROI in Los Angeles comes from the hours of material movement work a leased robot takes over from laborers and freight, stock, and material movers, hand, priced at the local wage shown on this page, minus the lease cost and the staff time the robot still needs. The savings range depends on how much of each shift is repeatable route work, how the building is laid out, and how often exceptions return work to staff. A free site assessment turns those inputs into a fixed lease quote and a payback range.
Key takeaways
- The return is built from hours taken over, the realistic share of work a robot can handle, and the fixed lease payment.
- Los Angeles has a large local labor pool for this job, so the wage is the main cost input, not the supply of workers.
- Repeatable point to point routes produce the strongest return, while judgment work stays with staff.
- Payback is measured from go live, after routes are tuned and exceptions are logged.
- A free site assessment is the only way to get a precise range and a lease quote.
Run the numbers for your site
Auto-detected from your location - we use the real BLS wage here. Not right? Pick your city or state above.
What do you want to automate?
The robot takes the repetitive cart and pallet moves off the heaviest motion.
What is autonomous mobile robot ROI in Los Angeles?
Autonomous mobile robot ROI in Los Angeles is the payback on a leased robot that moves freight, stock and materials inside a site, measured against the labor hours that the robot replaces. The return depends on local labor, the kind of building, and how much of each shift the robot can take over without creating new work for staff. A robot that covers the wrong share of the work will look attractive on paper and disappoint in operation.
The local labor base is large. According to the U.S. Bureau of Labor Statistics, Occupational Employment and Wage Statistics for May 2024, about 128,800 people were employed as laborers and freight, stock, and material movers, hand in the Los Angeles-Long Beach-Anaheim metro area, second nationally behind Chicago-Naperville-Elgin at 146,710. A deep pool makes staffing easier, but it does not lower the cost of an hour of this work. The wage for this job appears in the government wage panel on this page, and the savings math is priced on that wage.
Adoption is also rising. According to the International Federation of Robotics, as reported by DC Velocity, transportation and logistics was the top application for professional service robots in 2025, with about 117,500 units sold, roughly 47% of the category and up 21%. Adoption at that scale means customers of leased robots have more reference sites, but a national trend does not tell a Los Angeles site what its own return will be.
Where does the return come from in a Los Angeles building?
The return comes from hours. Each hour a robot covers on a repeatable route is an hour that no longer has to come from payroll or overtime. Los Angeles County has a large base of this work. CBRE reported in its Q3 2025 greater Los Angeles industrial figures that transportation and warehousing employed 207,000 people at the end of the third quarter of 2025, unchanged from a year earlier and up 6.1% over five years.
Warehousing and storage in the Los Angeles-Long Beach-Glendale metro division is a narrower measure. Using BLS data published through the Federal Reserve Bank of St. Louis FRED database, employment in that series was 22.2 thousand in 2023 and 20.5 thousand in 2025. We did not confirm that this metro division matches Los Angeles County, so read the trend as a direction, not as a county count.
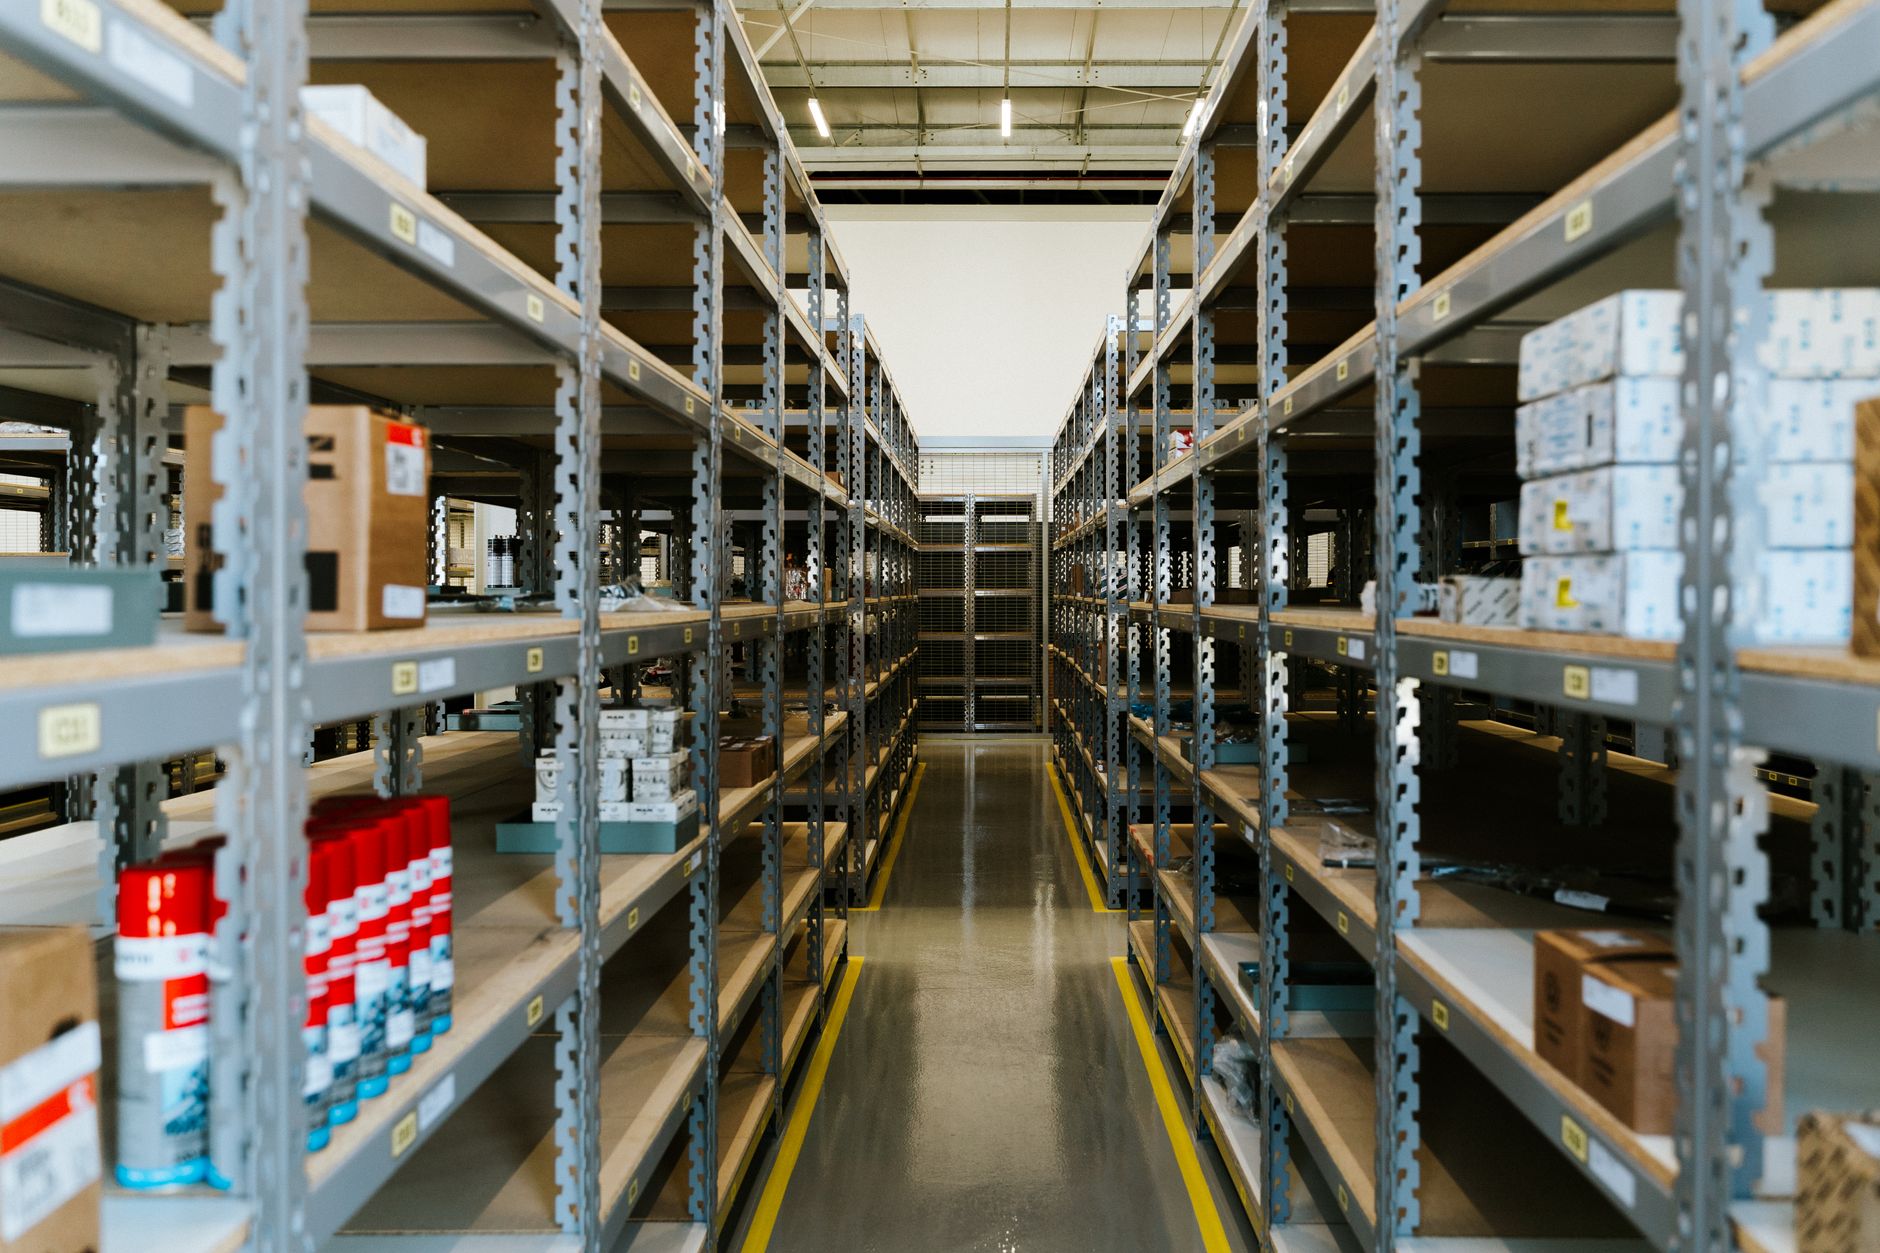
The building stock shapes the return as much as the labor base does. CBRE's 2024 review of Los Angeles County big-box industrial space found that the inventory is dominated by buildings constructed before 2000, and that 85% of its big-box buildings are under 500,000 square feet. Older, smaller buildings usually have tighter aisles, uneven slabs and more turns per route, which lowers the share of work a robot can take. Those conditions are the first things to measure.
Median hourly wage, Laborers and Freight, Stock, and Material Movers, Hand
$4,411
Monthly cost of one full-time worker in Los Angeles, CA, at the median wage plus payroll costs (an estimate, not a quote).
How is the payback calculated?
The math has four parts. First, the hours of material movement work the robot takes over in a typical week, taken from a time study or task log. Second, the share of those hours a robot can realistically handle, since not every trip is repeatable. Third, the local wage for laborers and freight, stock, and material movers, hand, applied to those hours. Fourth, the fixed lease payment, plus the staff time needed to load the robot, clear exceptions and supervise its route.
Net savings equal the wage value of the hours taken over, minus the lease cost, minus the staff time the robot still uses. Payback is the point where cumulative net savings cover the setup and integration cost. The output should be a range, not a single figure, because every input is an estimate until the site has run long enough to confirm it.
The formula is simple, and the errors come from the inputs. A site that counts every trip but ignores charging, exception handling and dock coordination will overstate the return. A site that counts only its easiest route will understate it. Use the same inputs for every option you compare, so the differences reflect the equipment and the lease, not the assumptions.
What share of the work does a robot realistically take?
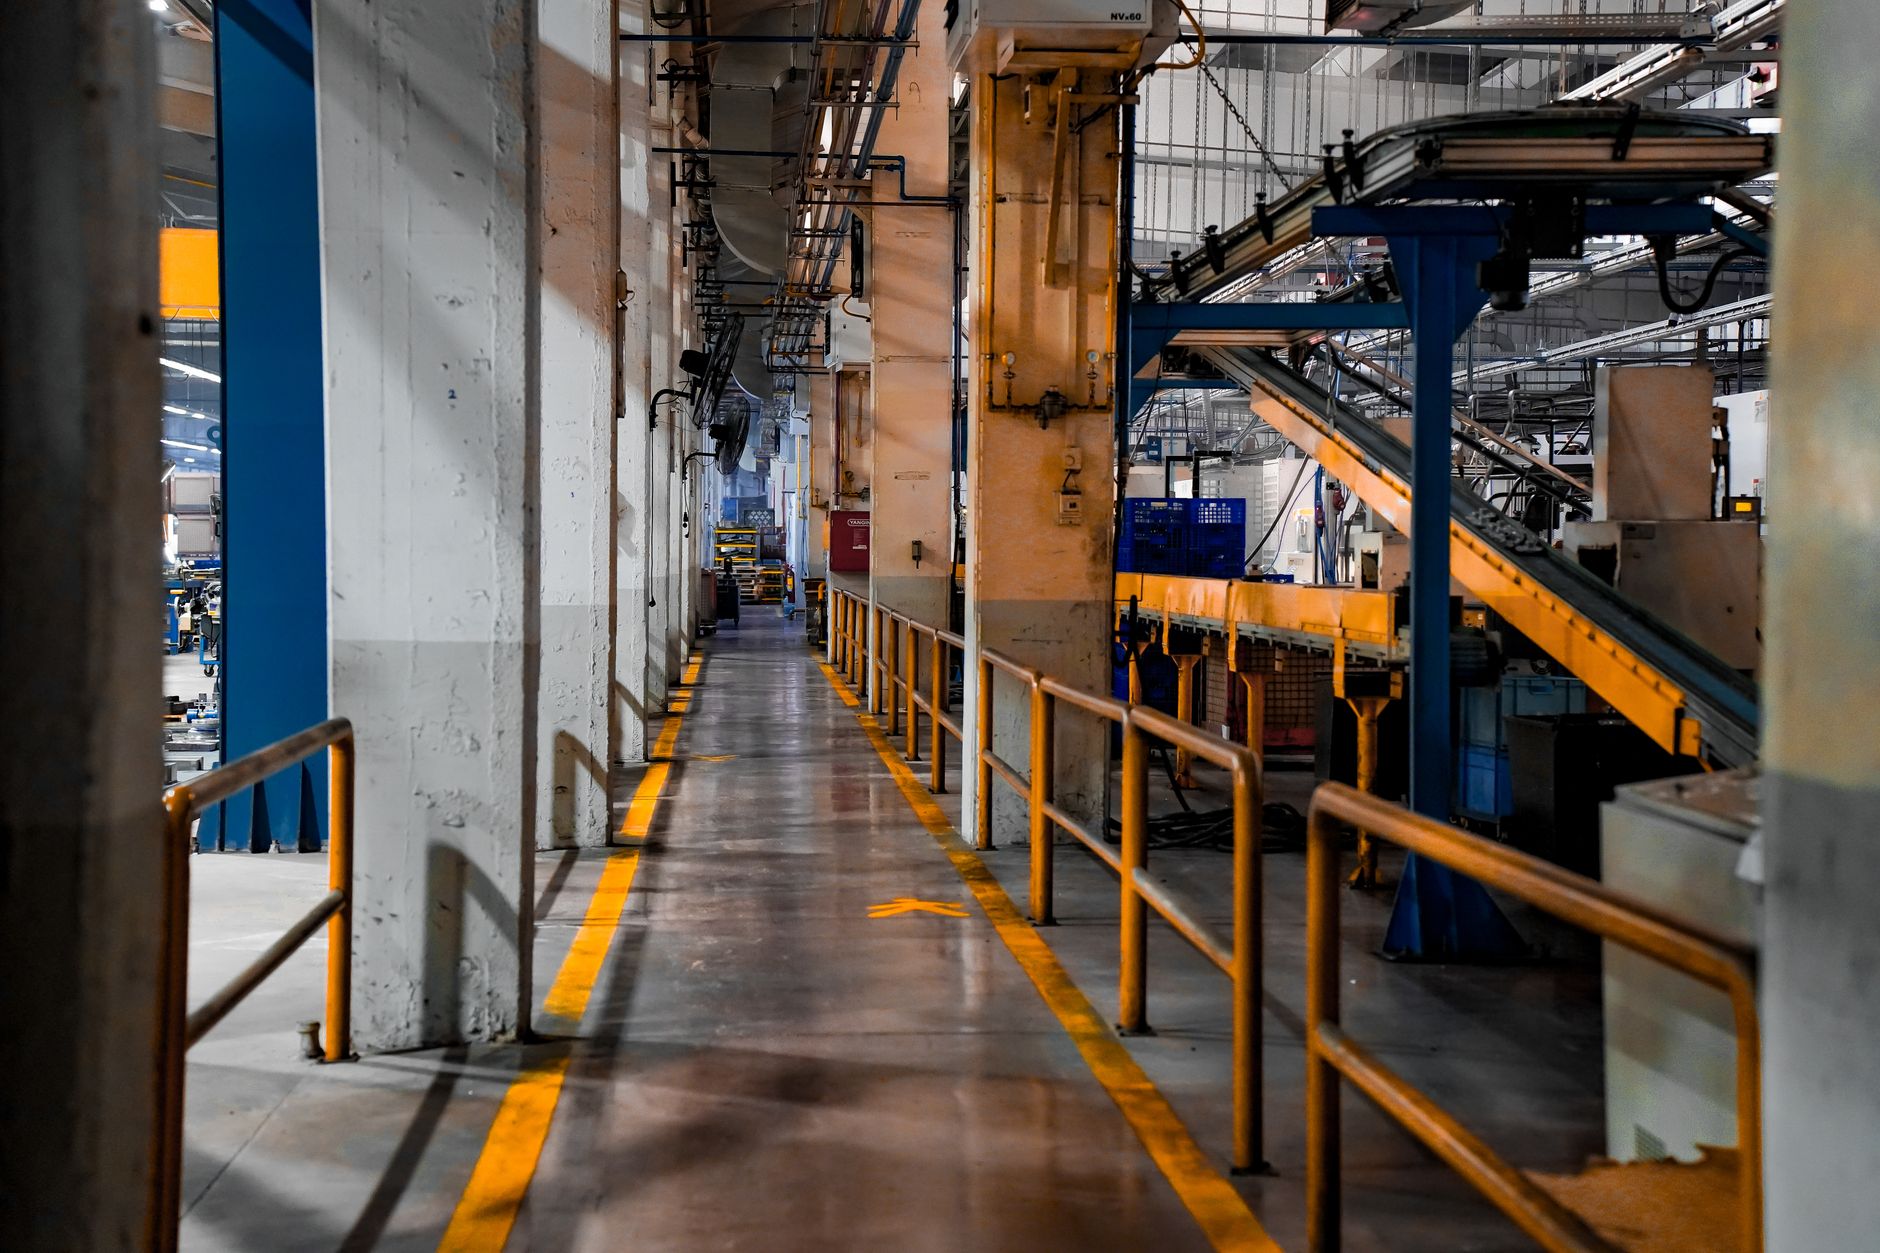
Realistic share moves the number more than any other input. A robot is strongest on repeat, point to point trips on fixed routes, such as receiving to reserve racking, staging to the dock, and transfers between cross aisles. It is weakest on loads that need a person to decide, on unusual pallets, and on tasks that involve hands, stairs or tight spaces.
Start by sorting every task that laborers and material movers perform into repeatable route work and judgment work. The repeatable share is the pool a robot can take. Judgment work stays with staff, and the savings range on this page assumes it still does. A site that moves judgment work onto the robot will see exceptions pile up and the net return fall.
The table below shows how to sort the work. The hour figures are not part of our verified research for this page, so the site should fill them in from its own time study during the assessment.
What changes the number up or down?
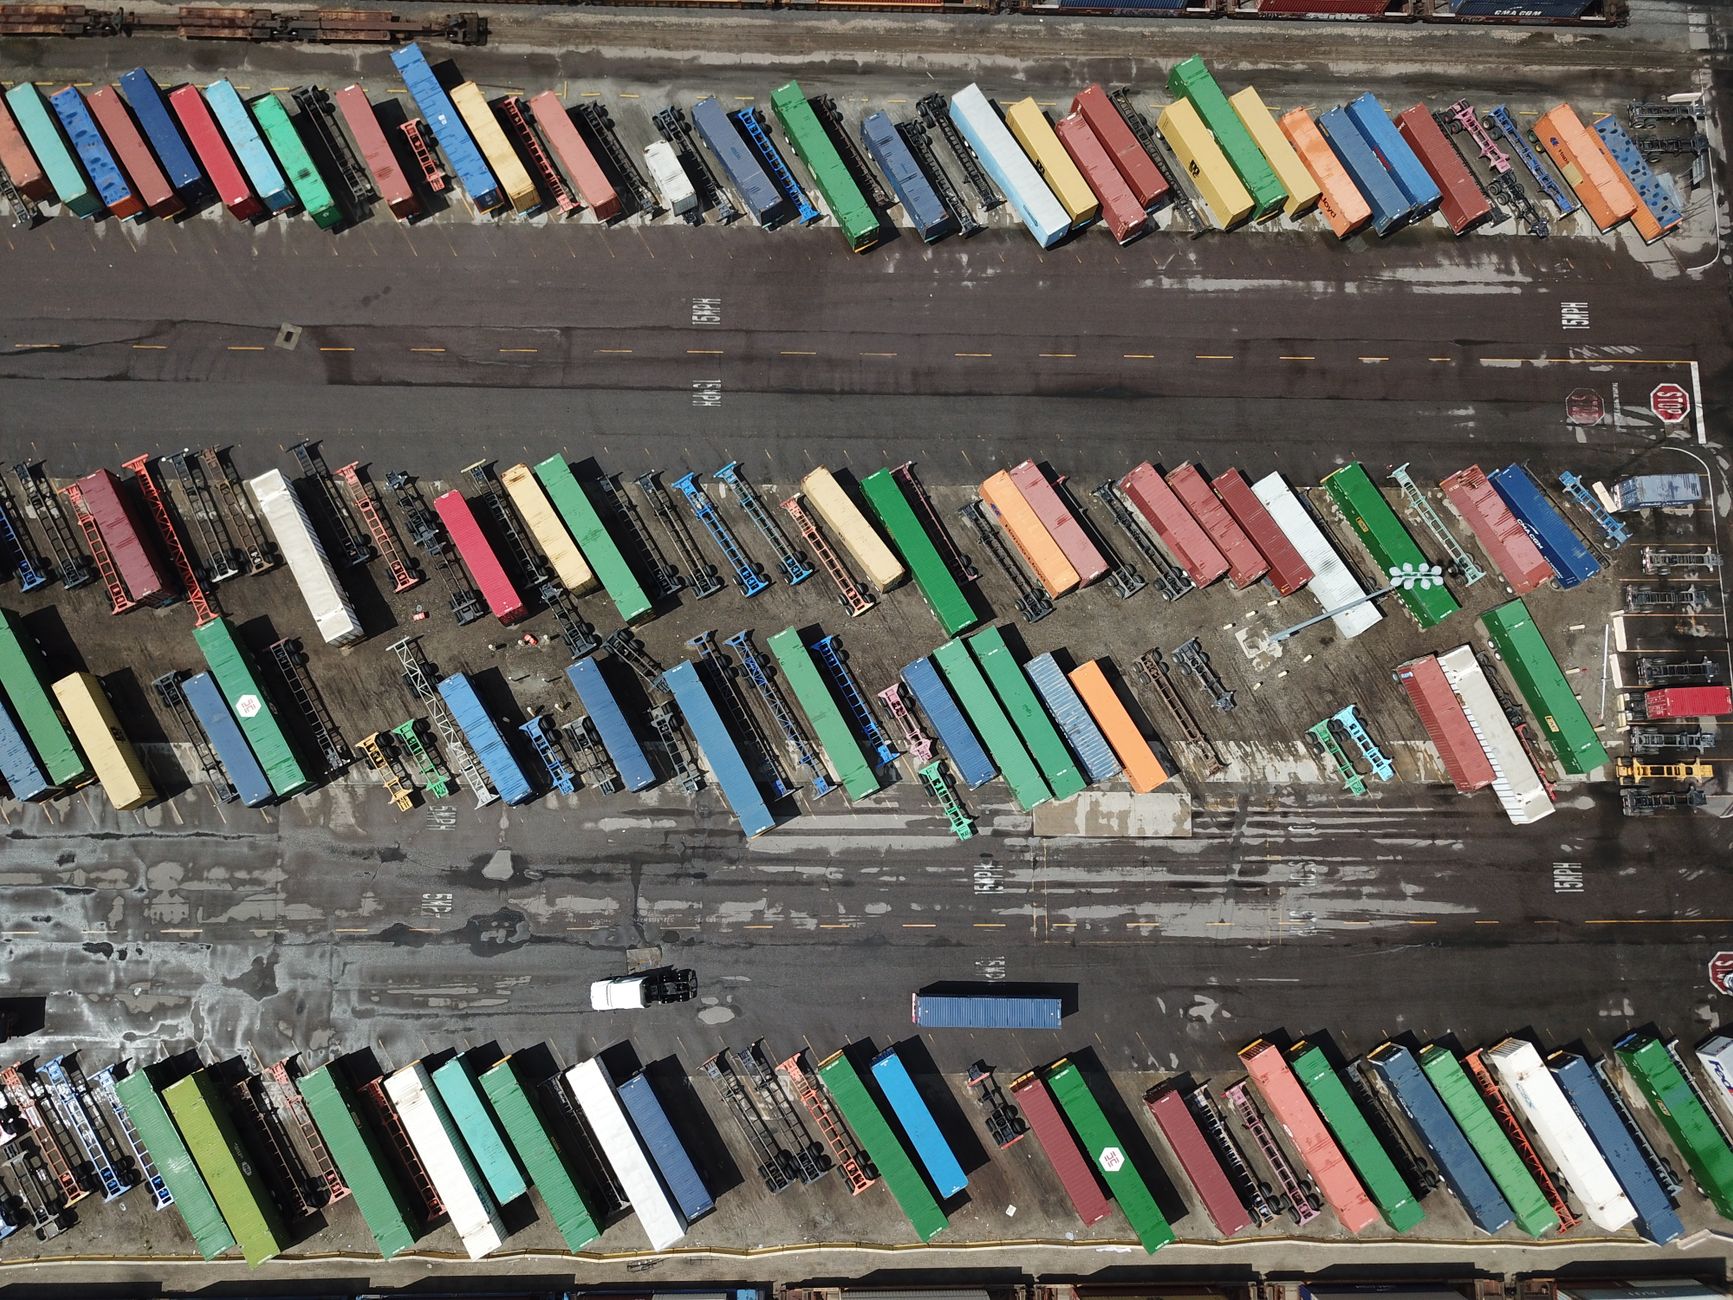
Several factors move the range in both directions. The most important is how repetitive the routes are and how long each one runs. Long, predictable routes with steady volume raise the share a robot can take. Short, varied routes with frequent changes lower it. The checklist below is what we check before a lease quote is written.
Coverage hours matter too. A robot that runs during shifts already staffed does not replace the same hours as one that covers off-shift or weekend work. Overtime avoided is often a larger part of the return than base hours, which is why the time study should separate regular shifts from overtime. Peak volume periods can also require more coverage than the average week.
What are the risks to the return and how do you avoid them?
The biggest risk is overcounting hours. Overstated hours produce an overstated return, and a lease that does not match the actual work sits idle while the payment continues. Avoid this by using a time study taken across several normal shifts, not one good day, and by checking the result against the task log before the quote is signed.
Safety is the second risk. According to the U.S. Bureau of Labor Statistics industry profile for warehousing and storage, the total recordable case rate was 4.8 per 100 full-time workers in 2024, with 32 sector fatalities, up from 28 in 2023. A robot changes which tasks people do. It does not remove the need for traffic rules, marked zones and training, so those costs belong in the deployment plan.
The third risk is downtime. When the robot stops, its work returns to staff. The lease quote should state how a failed unit is replaced and how fast service responds, and whether backup coverage is part of the agreement. Ask for those terms in writing before the decision, not after the first outage.
Who does this work today and how easy is it to staff?
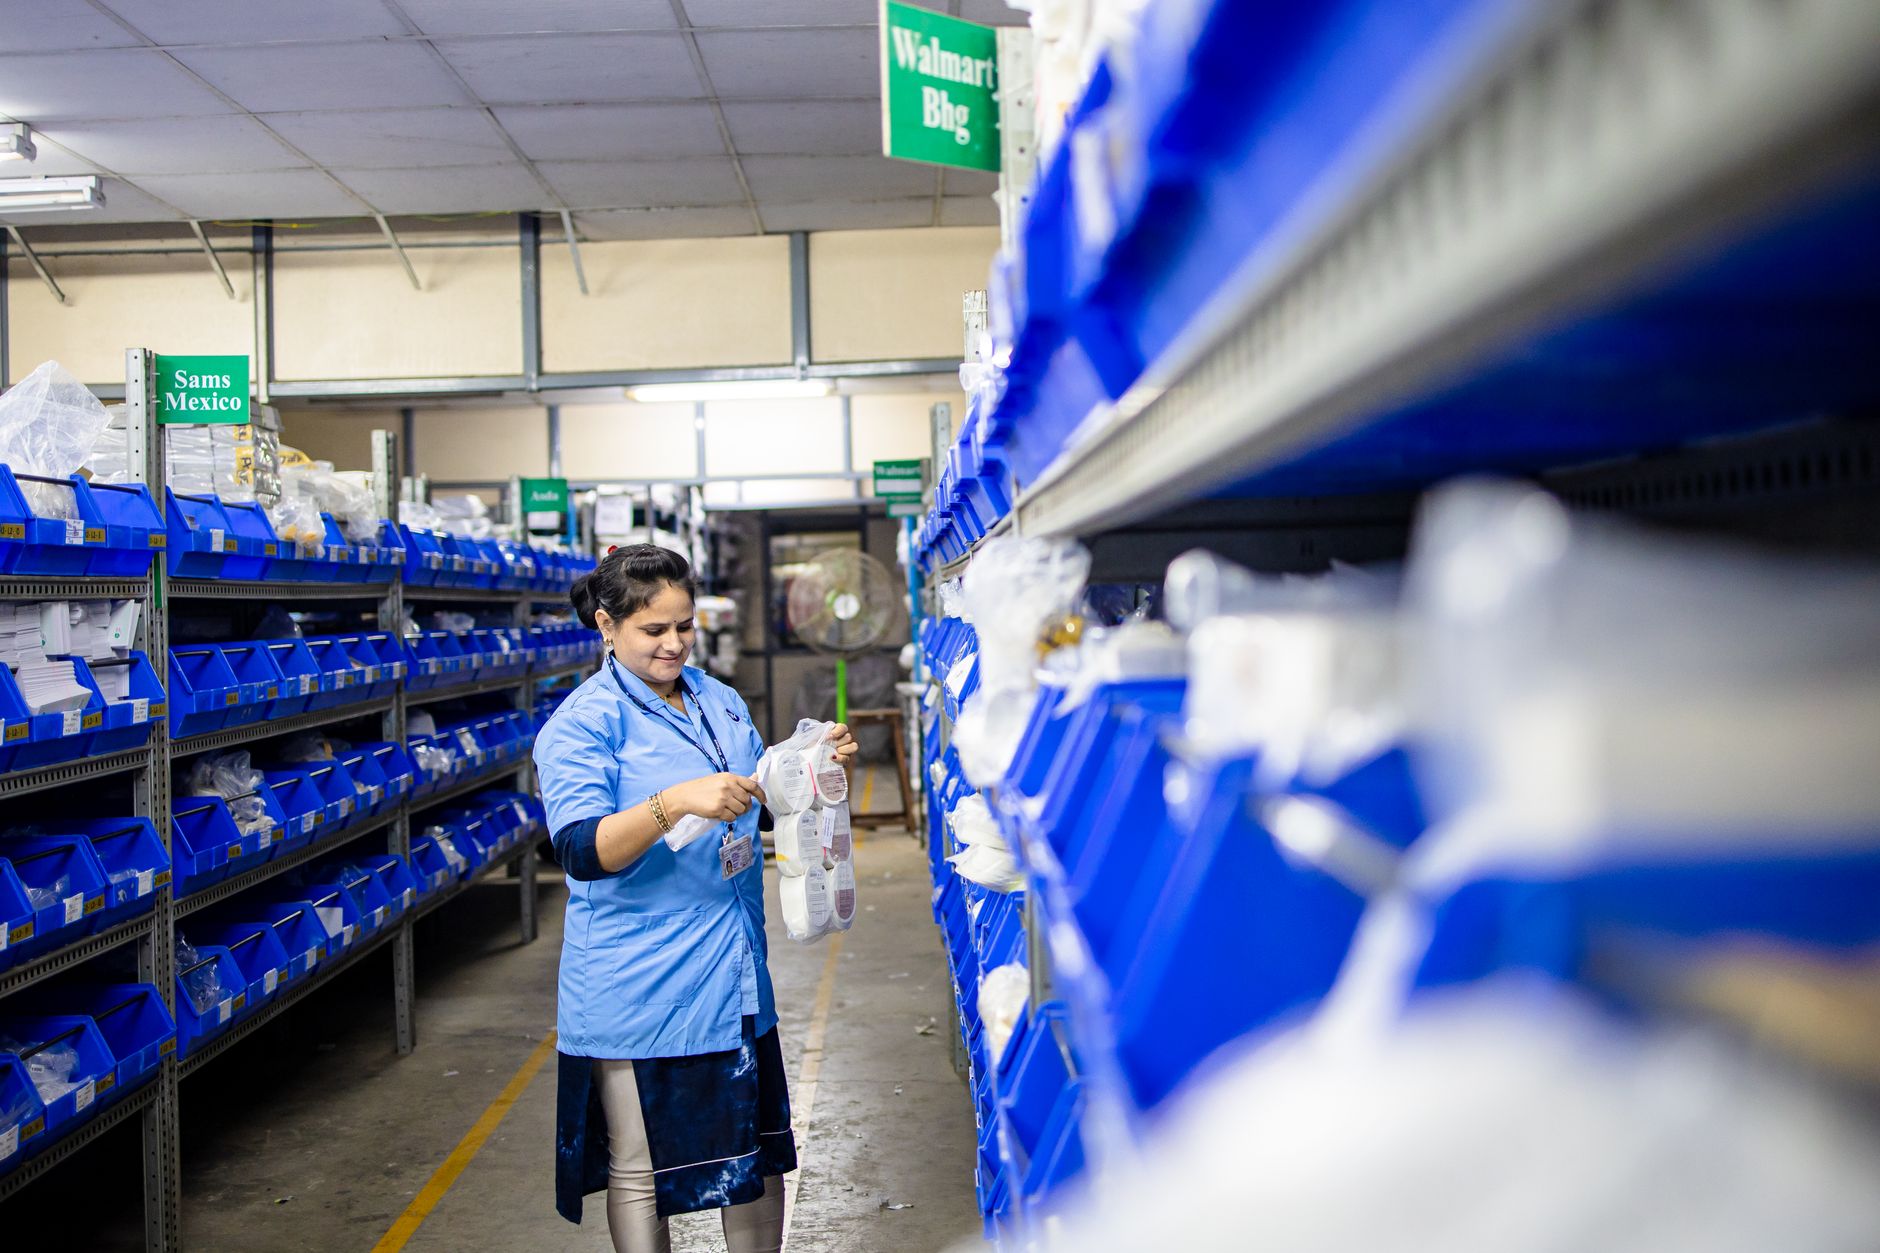
The Bureau of Labor Statistics Occupational Outlook Handbook counted 6,950,000 jobs for hand laborers and material movers nationally in 2024, with projected growth of 4% from 2024 to 2034, about 258,400 jobs. The entry requirement is no formal credential, with short on-the-job training. Staffing is possible in most markets, but the pool is large and high turnover makes training cost recur.
Turnover is harder to pin down. The BLS does not publish a separation rate for this occupation that we could verify for this run. The National Employment Law Project estimated annual turnover at Amazon warehouses in New Jersey at about 124 percent, using 2020 data. That is one employer and older data, so it shows the risk of high churn, not a county or occupation rate.
Headcount per site varies with the building and the shift pattern, and we did not verify a typical figure for this run. The headcount in the page data is a planning assumption. Replace it with the site's actual roster during the assessment, because the number of people doing this work drives how much staff time the robot frees and how much training it requires.
What does the timeline from assessment to payback look like?
The sequence runs in order: site assessment, route mapping, a pilot on a limited set of routes, go live with staff training, and then a review against the savings range. Each stage has a gate, so the lease does not expand until the first routes perform as the range predicted. Phased deployment also avoids shutting down the floor.
Payback follows go live, not signing. The early weeks usually carry extra staff time while routes are tuned and exceptions are logged. That time is normal, and the range should show it as a separate line so it does not get mistaken for a failure of the return.
The company picks the robot that fits the floor, leases it through financing, deploys and integrates it, trains the staff and services it nationwide. The assessment is free and comes before any lease discussion, so the decision maker sees the inputs before any payment is discussed.
How do you get a precise figure from a free site assessment?
A free site assessment turns the estimate into a figure. Bring the floor plan, the shift schedule, the most recent task logs or time study, aisle widths, the condition of the floor and the list of routes staff run most often. Those inputs are what the calculation needs, and the assessment checks each one against what is actually on the floor.
The output is a lease quote with a fixed lease payment, a savings range and a payback estimate, with the assumptions written out. Ask whether service is included, how the quote handles relocation, and what happens if a unit fails. Compare quotes on the same inputs: hours taken over, realistic share, staff time and term length.
No payment figure appears on this page because the quote follows the assessment. A quote built on verified inputs is the figure to sign against, and it is the only figure that should be used to decide.
Frequently asked questions
Put a robot to work in Los Angeles.
We walk your site, learn the job, and recommend the unit that fits. Then we quote the lease, deploy it, and keep it serviced.
Sources
- US Bureau of Labor Statistics, Occupational Employment and Wage Statistics (OEWS May 2024)
- U.S. Bureau of Labor Statistics, OEWS May 2024 occupational employment by area, Los Angeles-Long Beach-Anaheim
- U.S. Bureau of Labor Statistics, industry profile for warehousing and storage (NAICS 493)
- U.S. Bureau of Labor Statistics, Occupational Outlook Handbook: Hand Laborers and Material Movers
- Federal Reserve Bank of St. Louis, FRED: Warehousing and storage employment, Los Angeles-Long Beach-Glendale metro division (BLS data)
- CBRE, Greater Los Angeles Industrial Figures Q3 2025
- CBRE, 2024 North America Industrial Big-Box Review: Los Angeles County
- DC Velocity, Nearly half of service robots sold in 2025 were used for transportation and logistics (citing IFR World Robotics)
- National Employment Law Project, Amazon New Jersey turnover data brief