
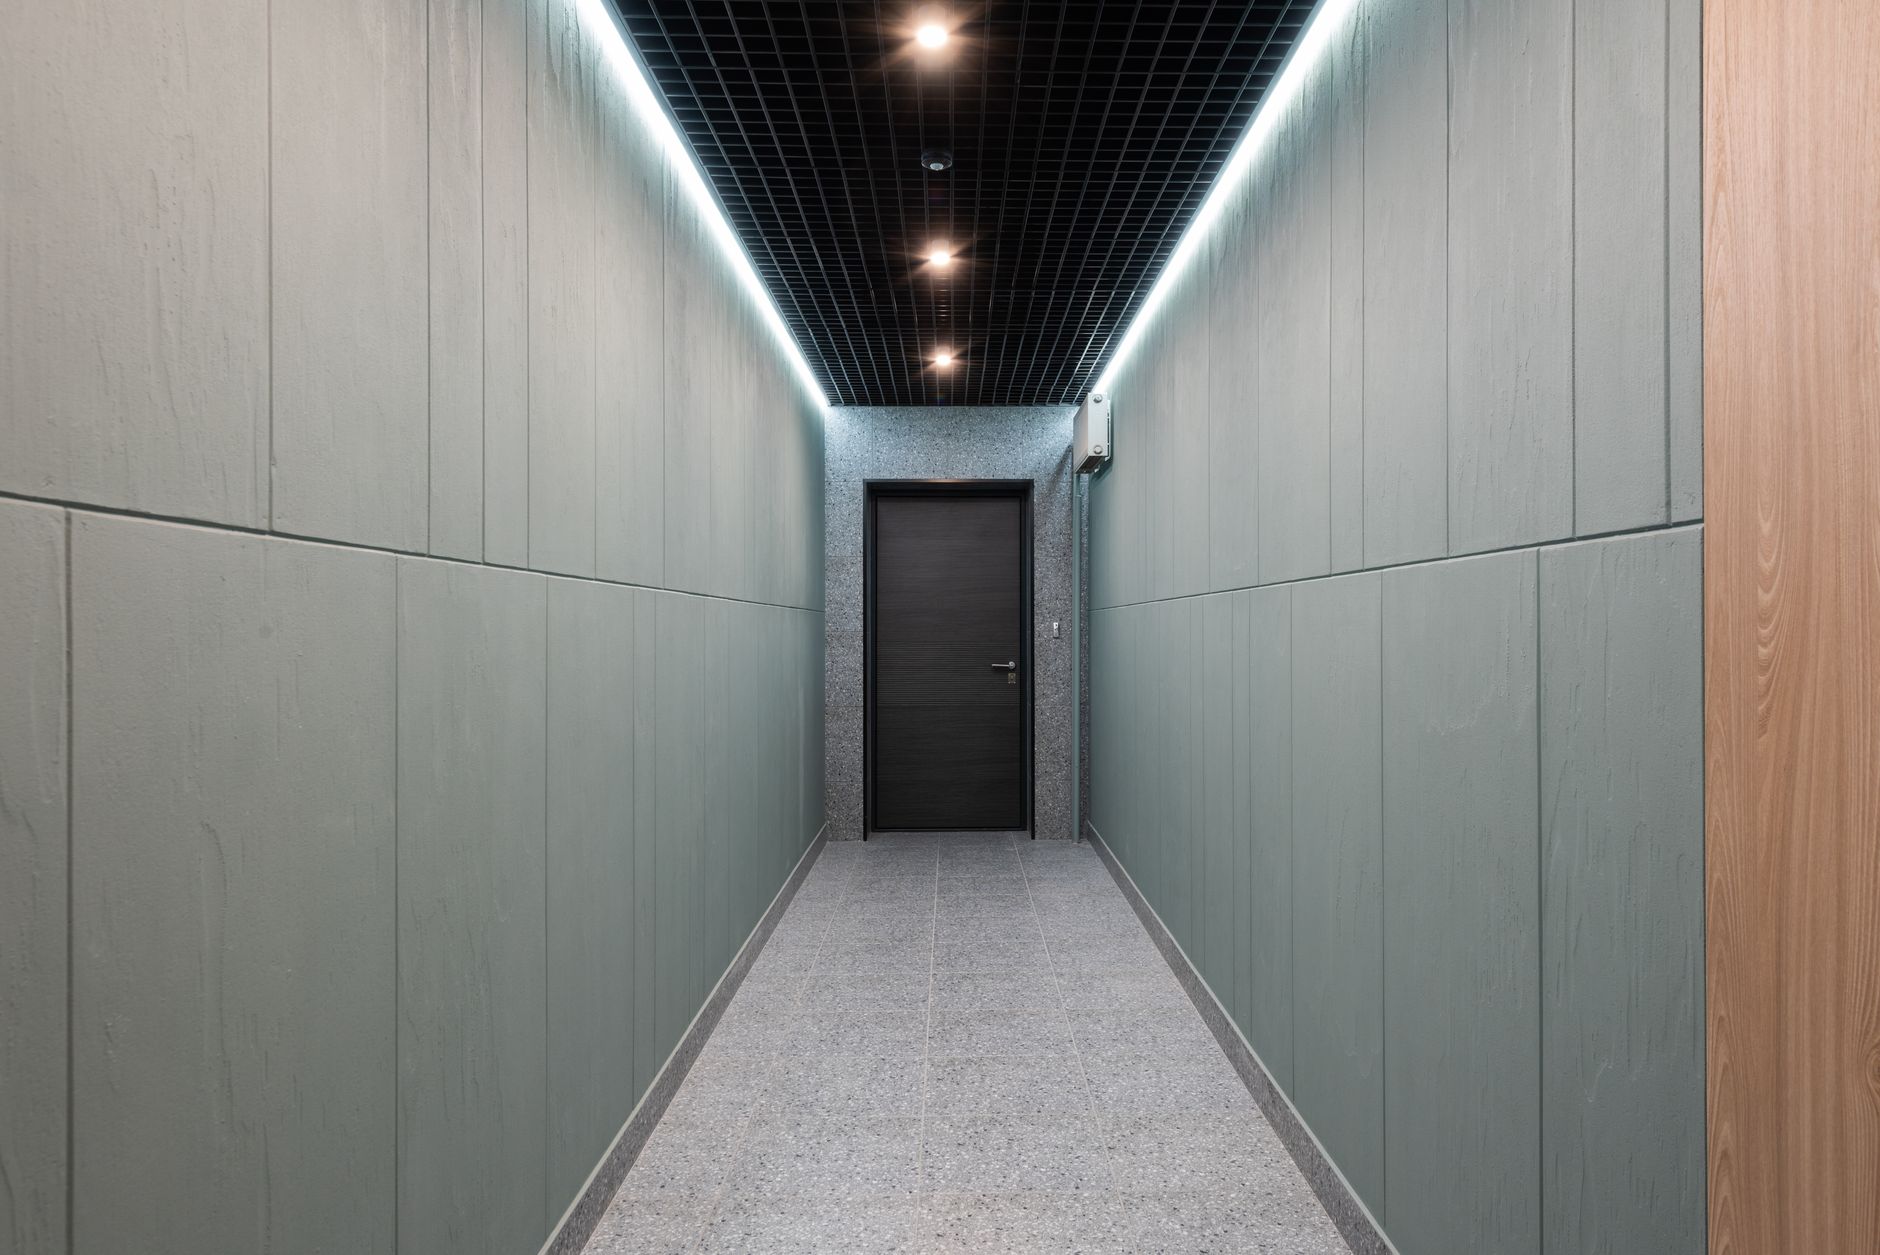
The short answer
Cleaning robot ROI for office buildings comes from janitorial hours that run after staff leave, mainly scheduled passes over open, hard-surface floors that are empty at night. The return is a range set by how many hours of janitor and building cleaner work the robot takes over, how much of that work it realistically completes, the lease cost quoted after a site assessment, and any night overtime the work triggers. Use the calculator on this page to see a savings range for your floors, then confirm it with a free site assessment.
Key takeaways
- The return comes from night hours of janitor-type work the robot takes over, not from cutting headcount.
- Open, hard-surface floors that are empty after hours are where the robot takes the largest share of work.
- The savings figure is a range, and the lease payment is set in a quote after a site assessment.
- Night overtime and unfilled shifts can move the math more than the base labor hours do.
- Starting with one leased unit lets you measure real hours before covering the whole building.
Run the numbers for your site
Pick your city or state for a real regional number - we use the real BLS wage there. (On the live site this auto-detects from your location.)
What do you want to automate?
The robot runs the open floor overnight; your crew keeps detail and edges.
What is cleaning robot ROI for office buildings?
Cleaning robot ROI for office buildings is the labor return from moving scheduled floor passes out of the paid night shift. A leased robot runs its route when the floors are empty, so the hours it covers are hours your staff spend on other work or do not spend at all. The return is a range, because it depends on how much of the nightly janitorial work sits on floors a robot can cover.
The setting suits this test. According to the EIA's 2018 Commercial Buildings Energy Consumption Survey, the US had about 5.9 million commercial buildings holding 96 billion square feet of floorspace, and office buildings made up 16 percent of the building count. The office category was the largest by floorspace and building count from 1999 to 2018, so there is a large base of similar buildings with a repeating night routine.
Office floors are mostly open, mostly hard surface and mostly empty after hours. That combination is what makes scheduled passes practical, and it is the first thing a site assessment checks.
How many office buildings are there, and is anyone already using these robots?
The EIA's Table B16 extract for the 2018 survey lists about 970 thousand office buildings, with about 16,662 million square feet and about 32,843 thousand workers. Dividing workers by buildings gives roughly 34 workers per office building, which is our own arithmetic from those counts. The median office building is about 5.0 thousand square feet. The extract was partly garbled in our pass, so check the published PDF before you quote these counts to a board.
Floor area per worker is 507 square feet, according to the same survey's flipbook. Office buildings fell slightly in number from 2012 to 2018 while total office floorspace still rose, so average building size went up.
Adoption is real but the data is thin. According to the 2025 ISSA Cleaning and Maintenance Management benchmarking survey, as listed among ISSA's published results, 43 percent of respondents reported plans for autonomous cleaning equipment. That is a general facility survey, not a robot study. A 2019 AACEM and ISSA autonomous cleaning survey went to nearly 23,000 building service contractors, in-house providers and facility managers, and its full report is limited to members.
Median hourly wage, Janitors and Building Cleaners
$4,041
Monthly cost of one full-time worker, at the median wage plus payroll costs (an estimate, not a quote).
Why is night janitorial labor hard to staff and budget?
The Bureau of Labor Statistics projects employment for janitors and building cleaners to grow 2 percent from 2024 to 2034, which its Occupational Outlook Handbook describes as slower than average. The May 2023 Occupational Employment and Wage Statistics table lists about 2,172,500 people employed in this occupation. A slow-growing pool means you should not plan on applicants arriving to fill night openings.
The handbook does not publish a turnover rate for this occupation, so the turnover in your building is the number to pull. Payroll records show night overtime hours, vacancies and the cost of covering them, and those internal records move the return more than any national average. The page data uses a planning headcount of two cleaning staff per office site, but our research found no published count of cleaning staff per office building, so the site assessment replaces that placeholder with your actual crew.
The local wage for this job appears in the government wage data panel next to this text. The calculator uses that wage, and you can adjust it if your local market differs.

Which parts of an office building does a cleaning robot cover?
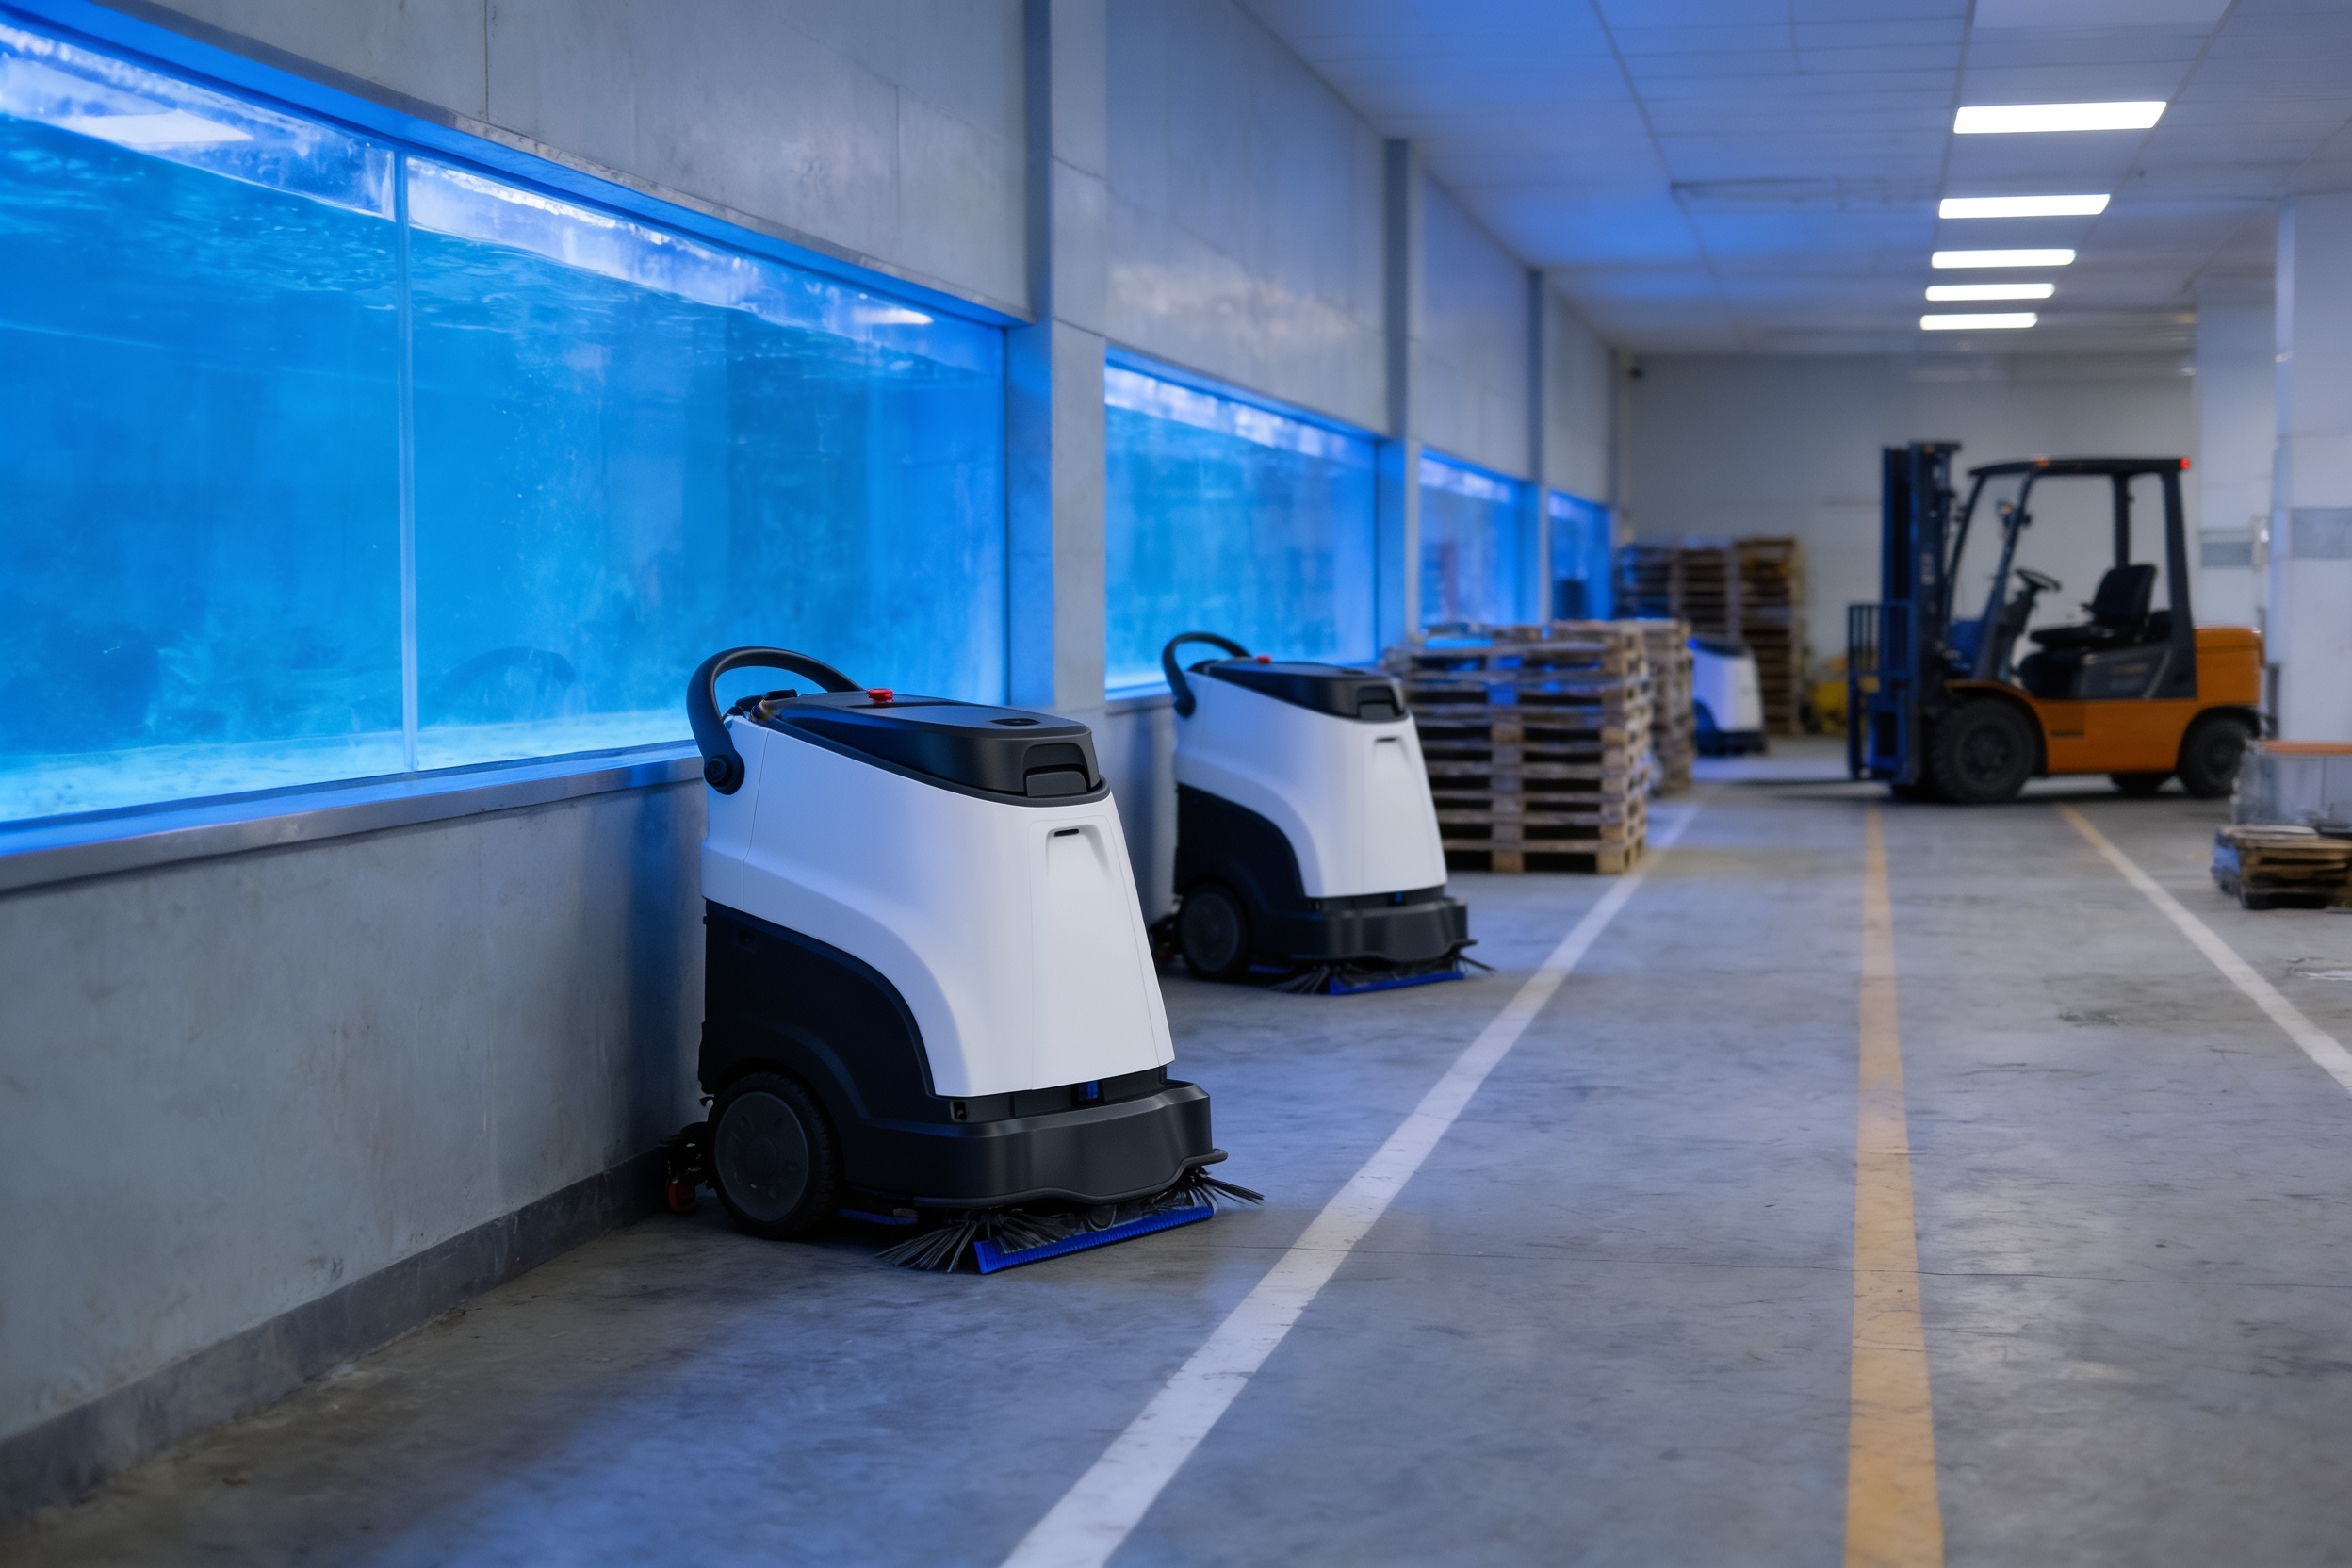
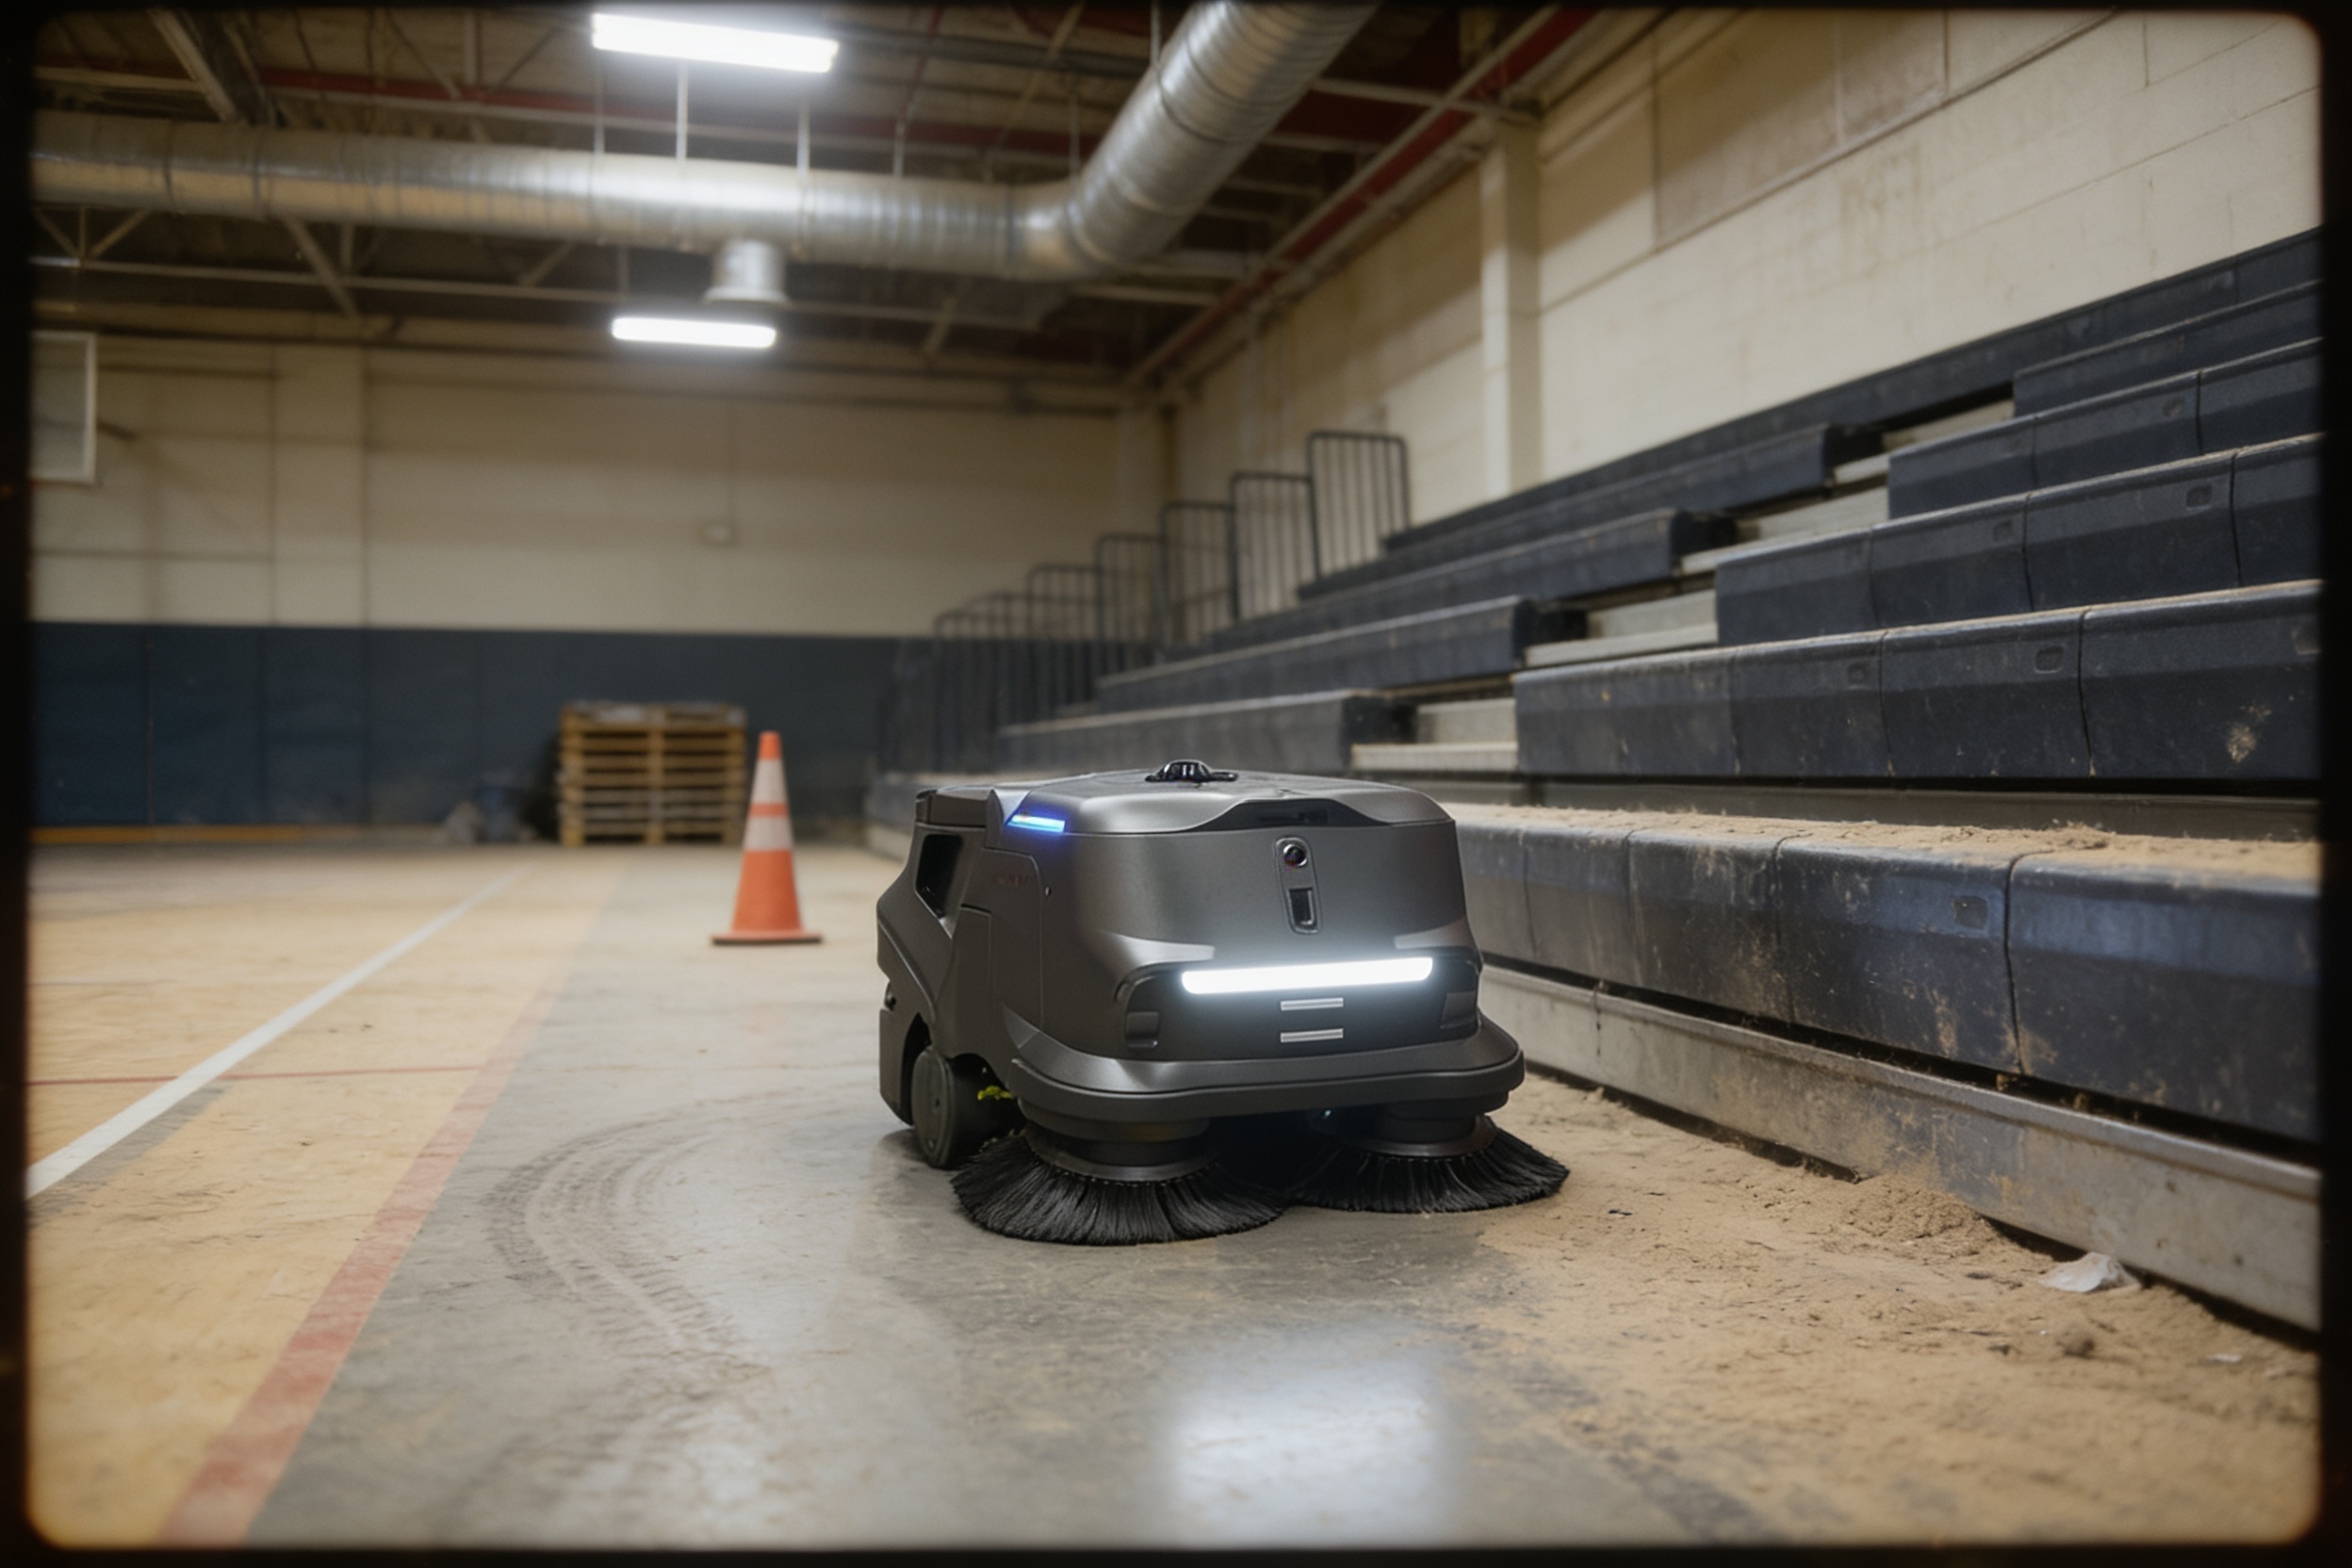
A cleaning robot works the hard floors that are clear at night: open work areas once desks are cleared, long corridors, lobbies and landings. Carpet, stairs and fixtures stay with staff. The split matters because the share of nightly work a robot can take depends on how much of the floor is a clear, hard surface.
Most setup problems come from clearance, not from the machine. Chairs pushed in, cords lifted, bins moved and doors held open are simple steps, but a missed one stops the route partway through. The zones below show where the robot typically works and where people still do the job.
Which hours of janitorial work does a cleaning robot take over?
Hour figures for office janitorial work were not found in published sources during our research, so this page does not quote a per-shift number. The useful figure is the one from your own logs, broken down by task. List each nightly task, how long it takes now, who does it and whether a robot can run it unattended.
The table below shows the structure. The hour values come from your logs and the site assessment, and the robot column shows what staff still do alongside the machine.
The overall offset is the part the robot runs unattended, minus the checks and setup that staff still perform. Setup happens once at go live, so keep it out of the nightly figure, or the first months will look worse than the steady state.
| Task | Today | With a robot |
|---|---|---|
| Clean open work areas after desks are clear | measured at site assessment | scheduled pass run unattended, staff clear obstacles first |
| Sweep main corridors and lobby tile | measured at site assessment | scheduled route, entrances checked by staff after the run |
| Map and approve the route | none | one-time setup at go live, kept out of nightly hours |
| Walk floors and check the run log | staff walk each floor | spot checks of flagged areas and the run log |
| Restrooms, break rooms and spills | staff by hand | stays with staff, not in the offset |
Hour values come from your own cleaning logs and the site assessment. Our research found no published per-shift hour figure for office janitorial work, so none is quoted here.
How does the savings range work, and what does the lease cost offset?
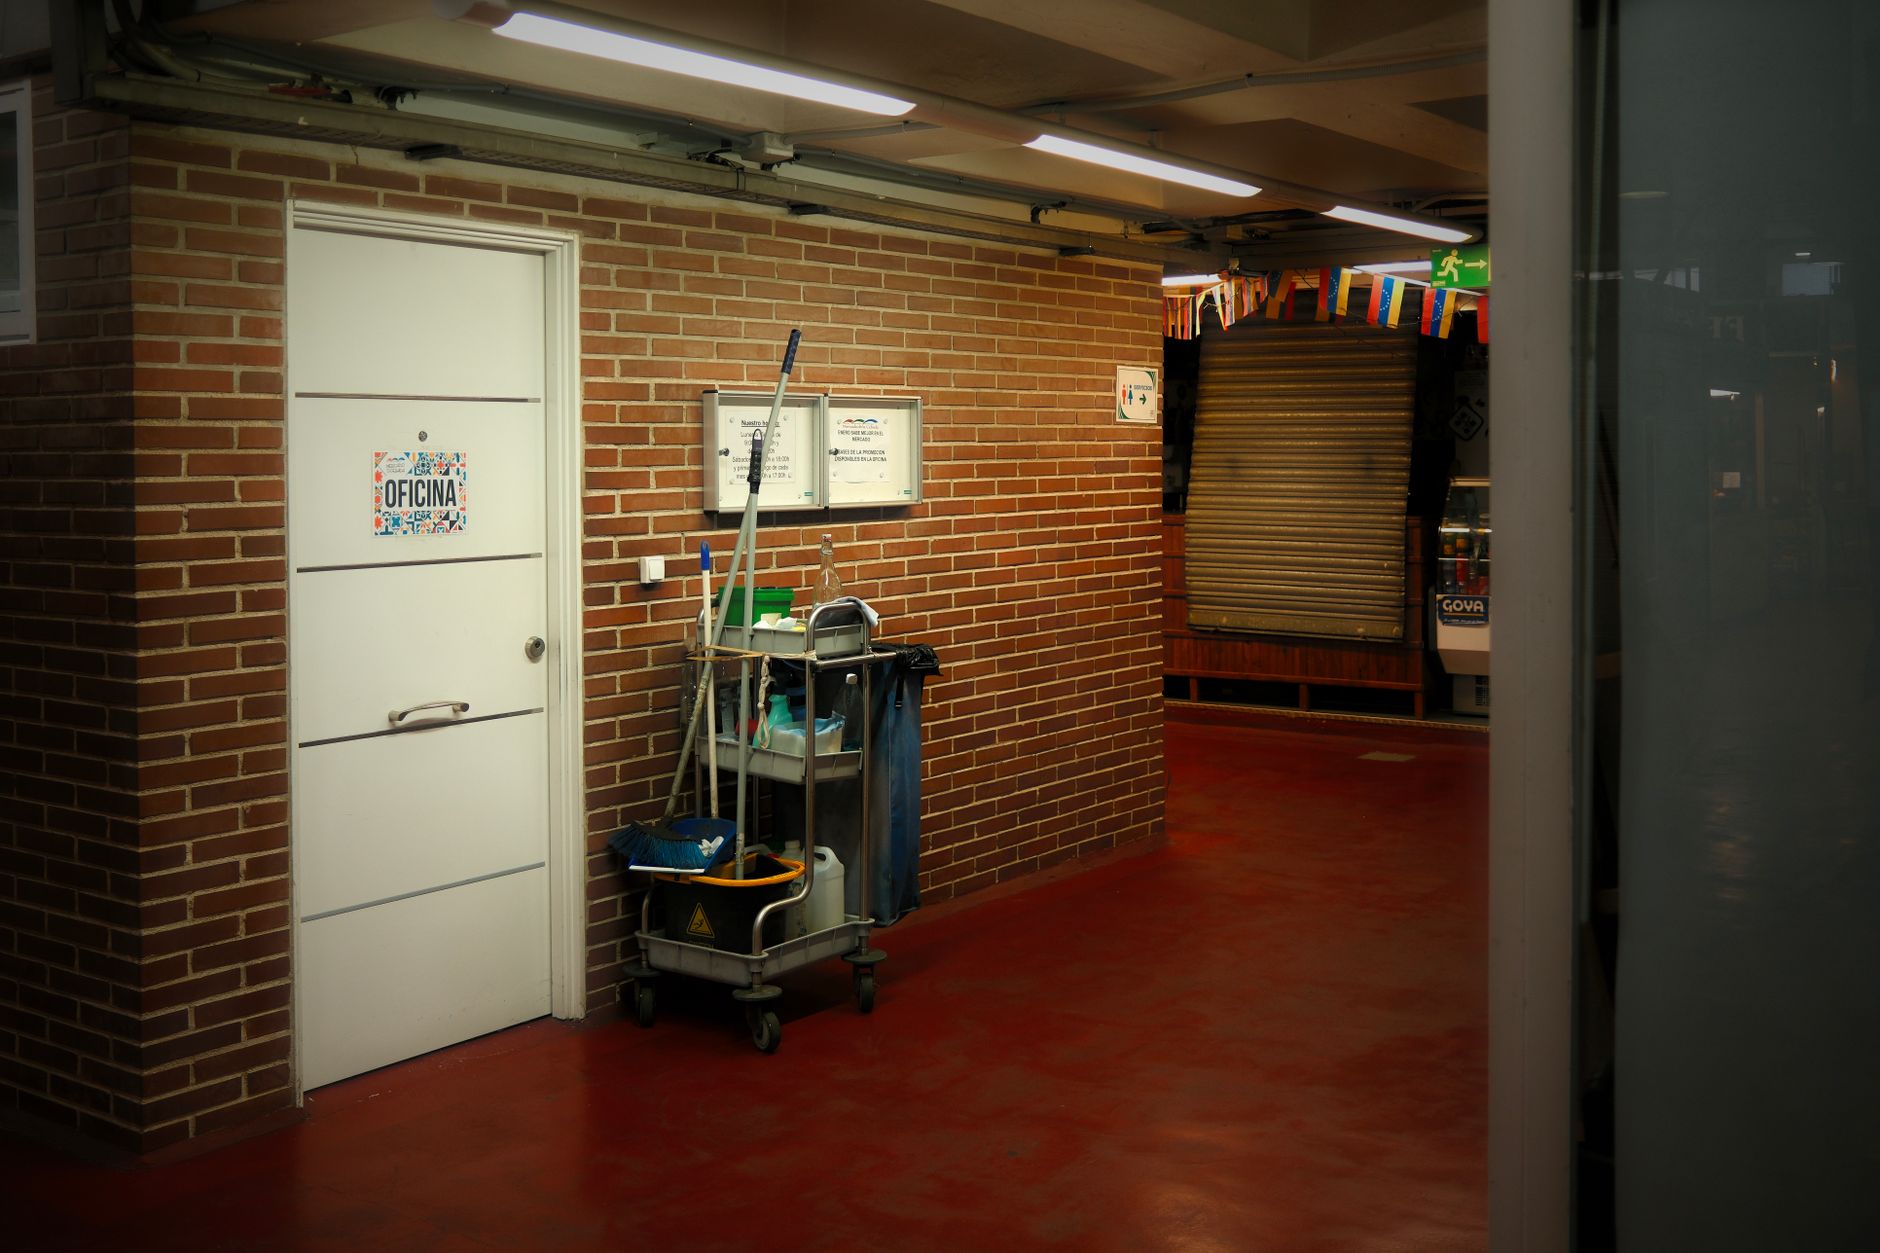
The math for cleaning robot ROI for office buildings has four parts. First, the nightly hours of janitor and building cleaner work the robot takes over. Second, the share of that work a robot realistically completes on a normal night, which is less than the full list because of carpet, clutter and interrupted runs. Third, the local wage for this job applied to those hours. Fourth, any overtime premium on the night shift that the robot removes.
Against those savings goes the lease payment, which is set in a quote after a site assessment, along with any service cost the lease does not cover. The calculator builds a range from a low and a high share of work, so you see the spread instead of one number. A savings range is an estimate until the assessment confirms the hours and the share.
Restroom work, detail cleaning and spill response still need people, so they stay out of the offset. A return that counts them as robot savings will look better on paper and worse in the first months of operation.
What changes the number up or down?
Floor area and the share of open, hard surface set how much of the night a robot can cover, so they are the largest inputs. Overtime on the night shift raises the value of every hour taken over, and vacancies can make an open shift worth more to cover than a single paid hour. Those inputs push the number up.
Heavy carpet, cluttered floors, a short night with little work to take over, and a lease term that ends before the robot has run long enough to pay back all push the number down. The checklist below lists what to verify before you sign anything.
What are the risks to the return, and how do you avoid them?
The main risks are a route that does not match the layout, staff who stop clearing the floor because they see the robot as extra work, a lease term that runs past the point of usefulness, and a unit that is down with no cover. Each one is manageable if the assessment deals with it first.
We take on the parts of the job that usually cause these problems. We pick the model for your floor, lease it through financing, deploy and integrate it, train your staff and service it nationwide, so one team owns the route, the training and the fault calls. Before you sign, get the response terms in writing and confirm what the lease includes for maintenance, insurance and repairs.
Injury risk belongs in the picture, though the data is general. According to Business Insurance, citing BLS, all private industry recorded 2.3 cases per 100 full-time equivalent workers in 2024, down from 2.4 in 2023. That figure covers every industry and does not isolate janitorial work, so treat it as context rather than a janitorial benchmark.
What is a realistic timeline from assessment to payback, and how do you get a precise figure?
The sequence starts with a free site assessment, where the floors are mapped and the night work is measured. It moves to a quote with the lease terms, then deployment and integration, staff training, and a go live with one unit before the rest of the building is covered. The payback point comes after the robot has run long enough to show the hours it actually takes over, so the first months of run data replace the estimate.
To get a precise figure, bring your night shift schedule, a year of overtime records, a list of hard-surface floors and the lease term you prefer. The assessment turns those into a route, a measured share of work and a quote. The range on this page narrows once those inputs are in.
Payback is the point where cumulative offset covers the lease cost and any setup. Because the lease payment comes from the quote, this page does not estimate that point for you.

Frequently asked questions
Want a cleaning robot at your office building?
Tell us about your site. We will recommend the robot, quote the lease, and keep it serviced.
Sources
- US Bureau of Labor Statistics, Occupational Employment and Wage Statistics (OEWS May 2024)
- BLS Occupational Outlook Handbook, janitors and building cleaners
- BLS Occupational Employment and Wage Statistics, May 2023, occupation 37-2011
- EIA Commercial Buildings Energy Consumption Survey 2018, Building Characteristics flipbook
- EIA CBECS 2018 Table B16, office buildings
- Business Insurance, work injuries down in 2024 citing BLS
- ISSA, going mainstream, 2025 benchmarking results
- ISSA and AACEM autonomous cleaning survey report