

The short answer
Cleaning robot ROI in Boston comes from the floor hours a leased robot can take over from janitors and building cleaners, measured as a share of that work rather than all of it. The savings range is that offset set against a fixed lease payment quoted after a free site assessment, and it moves with floor size, repetition and staffing gaps. Savings are estimates, not promises.
Key takeaways
- The return comes from floor hours a robot takes over, not from the robot alone.
- Only the share of repetitive floor work a robot can realistically run counts toward savings.
- The lease payment is quoted after a site assessment, so the range is built on your building.
- Large, clear, repeated floors give the largest return, while cluttered rooms keep the work with staff.
- Settle downtime cover and staff roles before signing, because they set the real result.
Run the numbers for your site
Auto-detected from your location - we use the real BLS wage here. Not right? Pick your city or state above.
What do you want to automate?
The robot runs the open floor overnight; your crew keeps detail and edges.
Cleaning robot ROI in Boston: where the return comes from
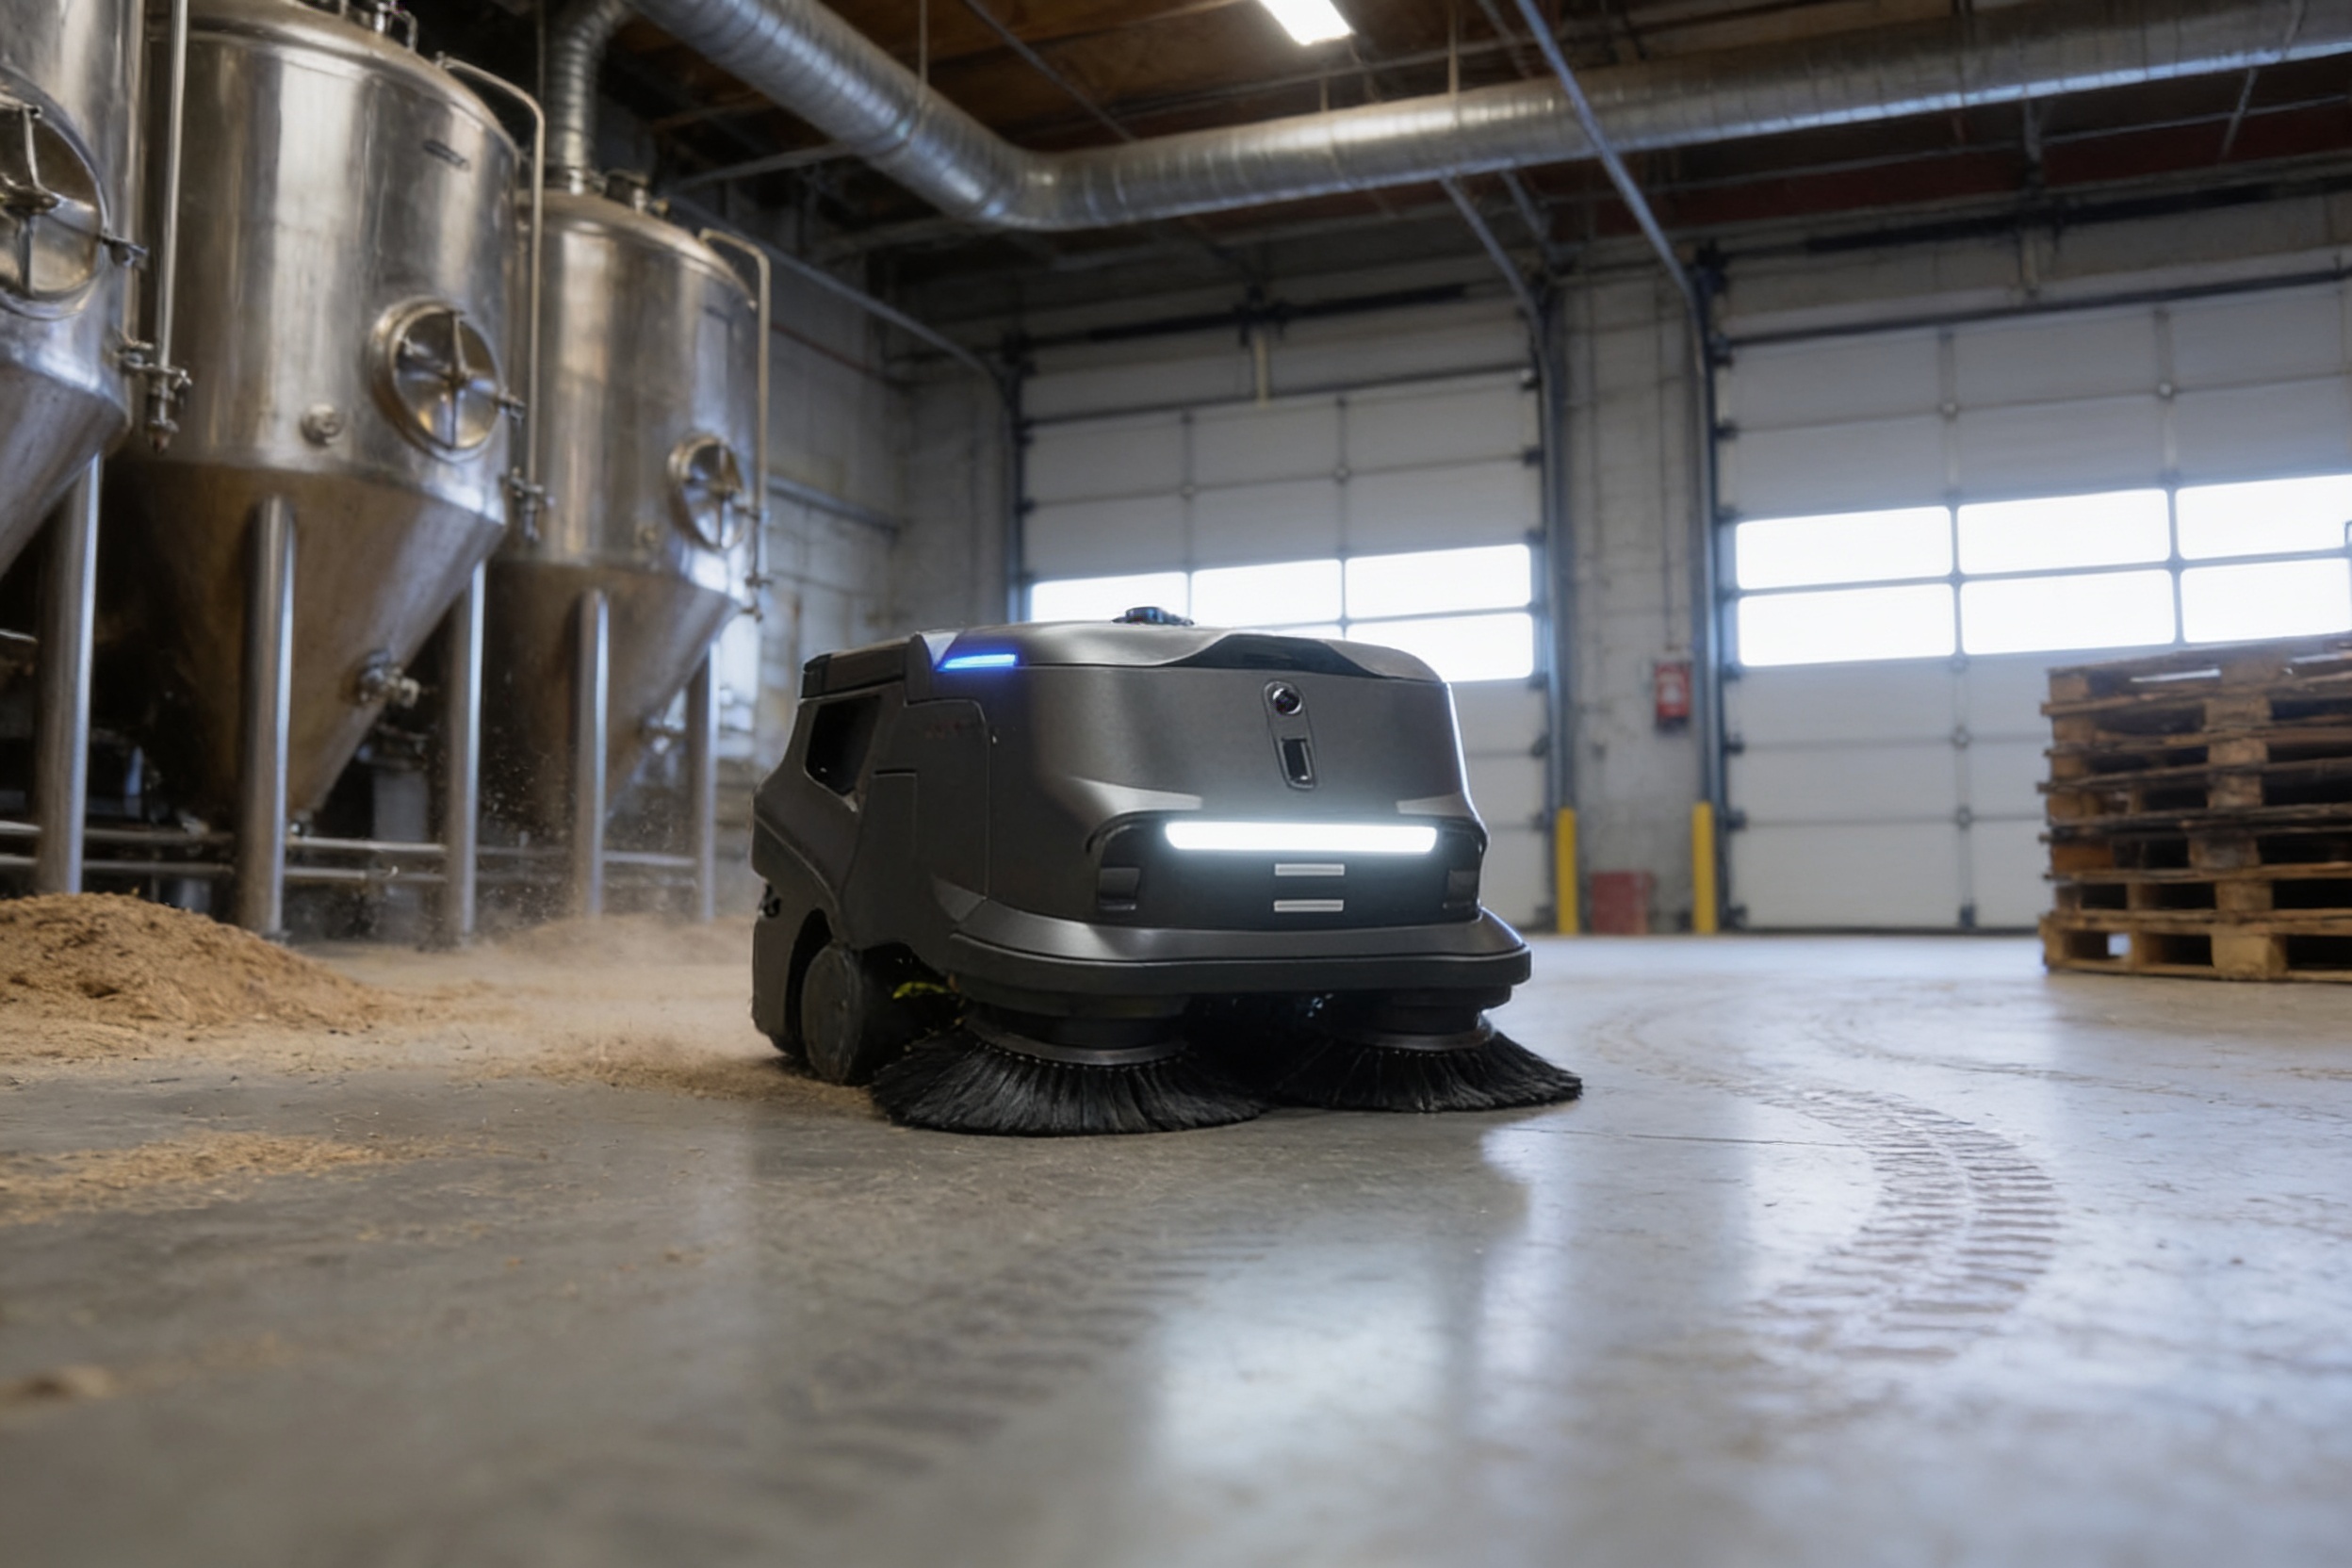
A cleaning robot earns its place in a Boston building by taking over floor work that is repetitive, scheduled and long, mainly the scrubbing and sweeping that janitors and building cleaners do on large hard floors. The return is not the machine itself. It is the hours a person no longer has to work, multiplied by the share of those hours the robot can realistically take, then set against the lease payment.
The largest returns come from lobbies, corridors, atriums, stores, terminals and warehouse aisles, where the same route repeats every night. The smallest come from cluttered rooms, restrooms, stairs and spot cleaning, which still need a person. Adoption is still early: an AACEM/ISSA autonomous cleaning survey from 2019 described adoption as in an infant stage, and about one-third of non-adopters said they were somewhat likely to adopt within a year.
What does labor cost a Boston site for this work?
The labor side is priced on the wage of janitors and building cleaners. The local wage for this job is shown in the panel beside this text, and the savings range uses that same occupation. If the people who mainly work your building hold a job such as nurse or guest service staff, the robot takes the janitors and building cleaners type of work off their plate, and their own time is not priced here.
Nationally the work is large and steady. According to the BLS Occupational Outlook Handbook, about 2,447,700 jobs were held by janitors and cleaners in 2024, and the projected change from 2024 to 2034 is 47,800 jobs, or 2% growth, which is slower than average. The handbook also projects about 351,300 openings a year, mostly from replacement needs. Each opening is a shift to recruit, train and cover, and that cost sits on top of the hourly wage.
We did not find an official turnover rate for this occupation in the sources we checked, so do not assume one. Use your own hiring records for the last year. Data USA reports 2,237,882 janitors and building cleaners in 2024, a count that does not match the BLS projection base, so treat the BLS figure as the scale check and your own records as the site check.
Median hourly wage, Janitors and Building Cleaners
$5,202
Monthly cost of one full-time worker in Boston, MA, at the median wage plus payroll costs (an estimate, not a quote).
How is the savings range calculated?
Start with the hours. Take the hours the janitors and building cleaners type of work takes on floors a robot can cover, then multiply by the share the robot realistically takes. A robot rarely takes all of it. Stairs, restrooms, detail work and spill response stay with staff, so the robot share is usually a fraction of the total.
Then price the offset. The hours the robot takes are valued at the local wage for this job, and that value is set against the fixed robot lease payment, which is quoted after a site assessment. The savings range is the spread between a low case and a high case for the robot share. The calculator on this page runs those cases with your building's inputs, and its result is an estimate.
Coverage rates help check the hour count. The equipment figures in the next section are ideal rates for a machine on clear floor, so a real route takes longer. Estimate hours from the route length, the machine's rate and the number of stops, not from the top rate alone.
| Task | Today | With a robot |
|---|---|---|
| Scrub the main corridors and lobby floors | the longest single block of the night shift | a route check and setup, then the robot runs the loop |
| Sweep open floors and entry areas | a daily pass by hand or with a sweeper | the robot sweeps its route once staff clear obstacles |
| Restrooms, stairs and detail corners | a large share of staff time once the open floors are done | still done by staff |
| Spills and unplanned cleanup | call-outs that interrupt the shift | still done by staff, with the robot paused |
| Close-out walk-through and log check | a manual walk at the end of the shift | staff review the robot's route log and flag problems |
These rows describe the kind of work, not measured hours. The hour counts come from the site assessment and your own shift records.
What changes the number up or down?
Four things move the range more than anything else: how much clear, flat, repetitive floor the building has, how many of its floor hours are done by people today, how often the staffing gap shows up as unfilled shifts, and whether the robot can run and charge without a person standing by. A building with long straight corridors and few obstacles sits at the high end. A building with many small rooms, heavy furniture and frequent thresholds sits at the low end.
The local wage matters too, and the government wage data on this page sets the starting point. Higher wages raise the value of each hour the robot takes, which widens the range. The range is still set by the hours taken, though, so a high wage on a small share of floor work moves the number less than a lower wage on a large one.
How much floor can a robot clean per hour?
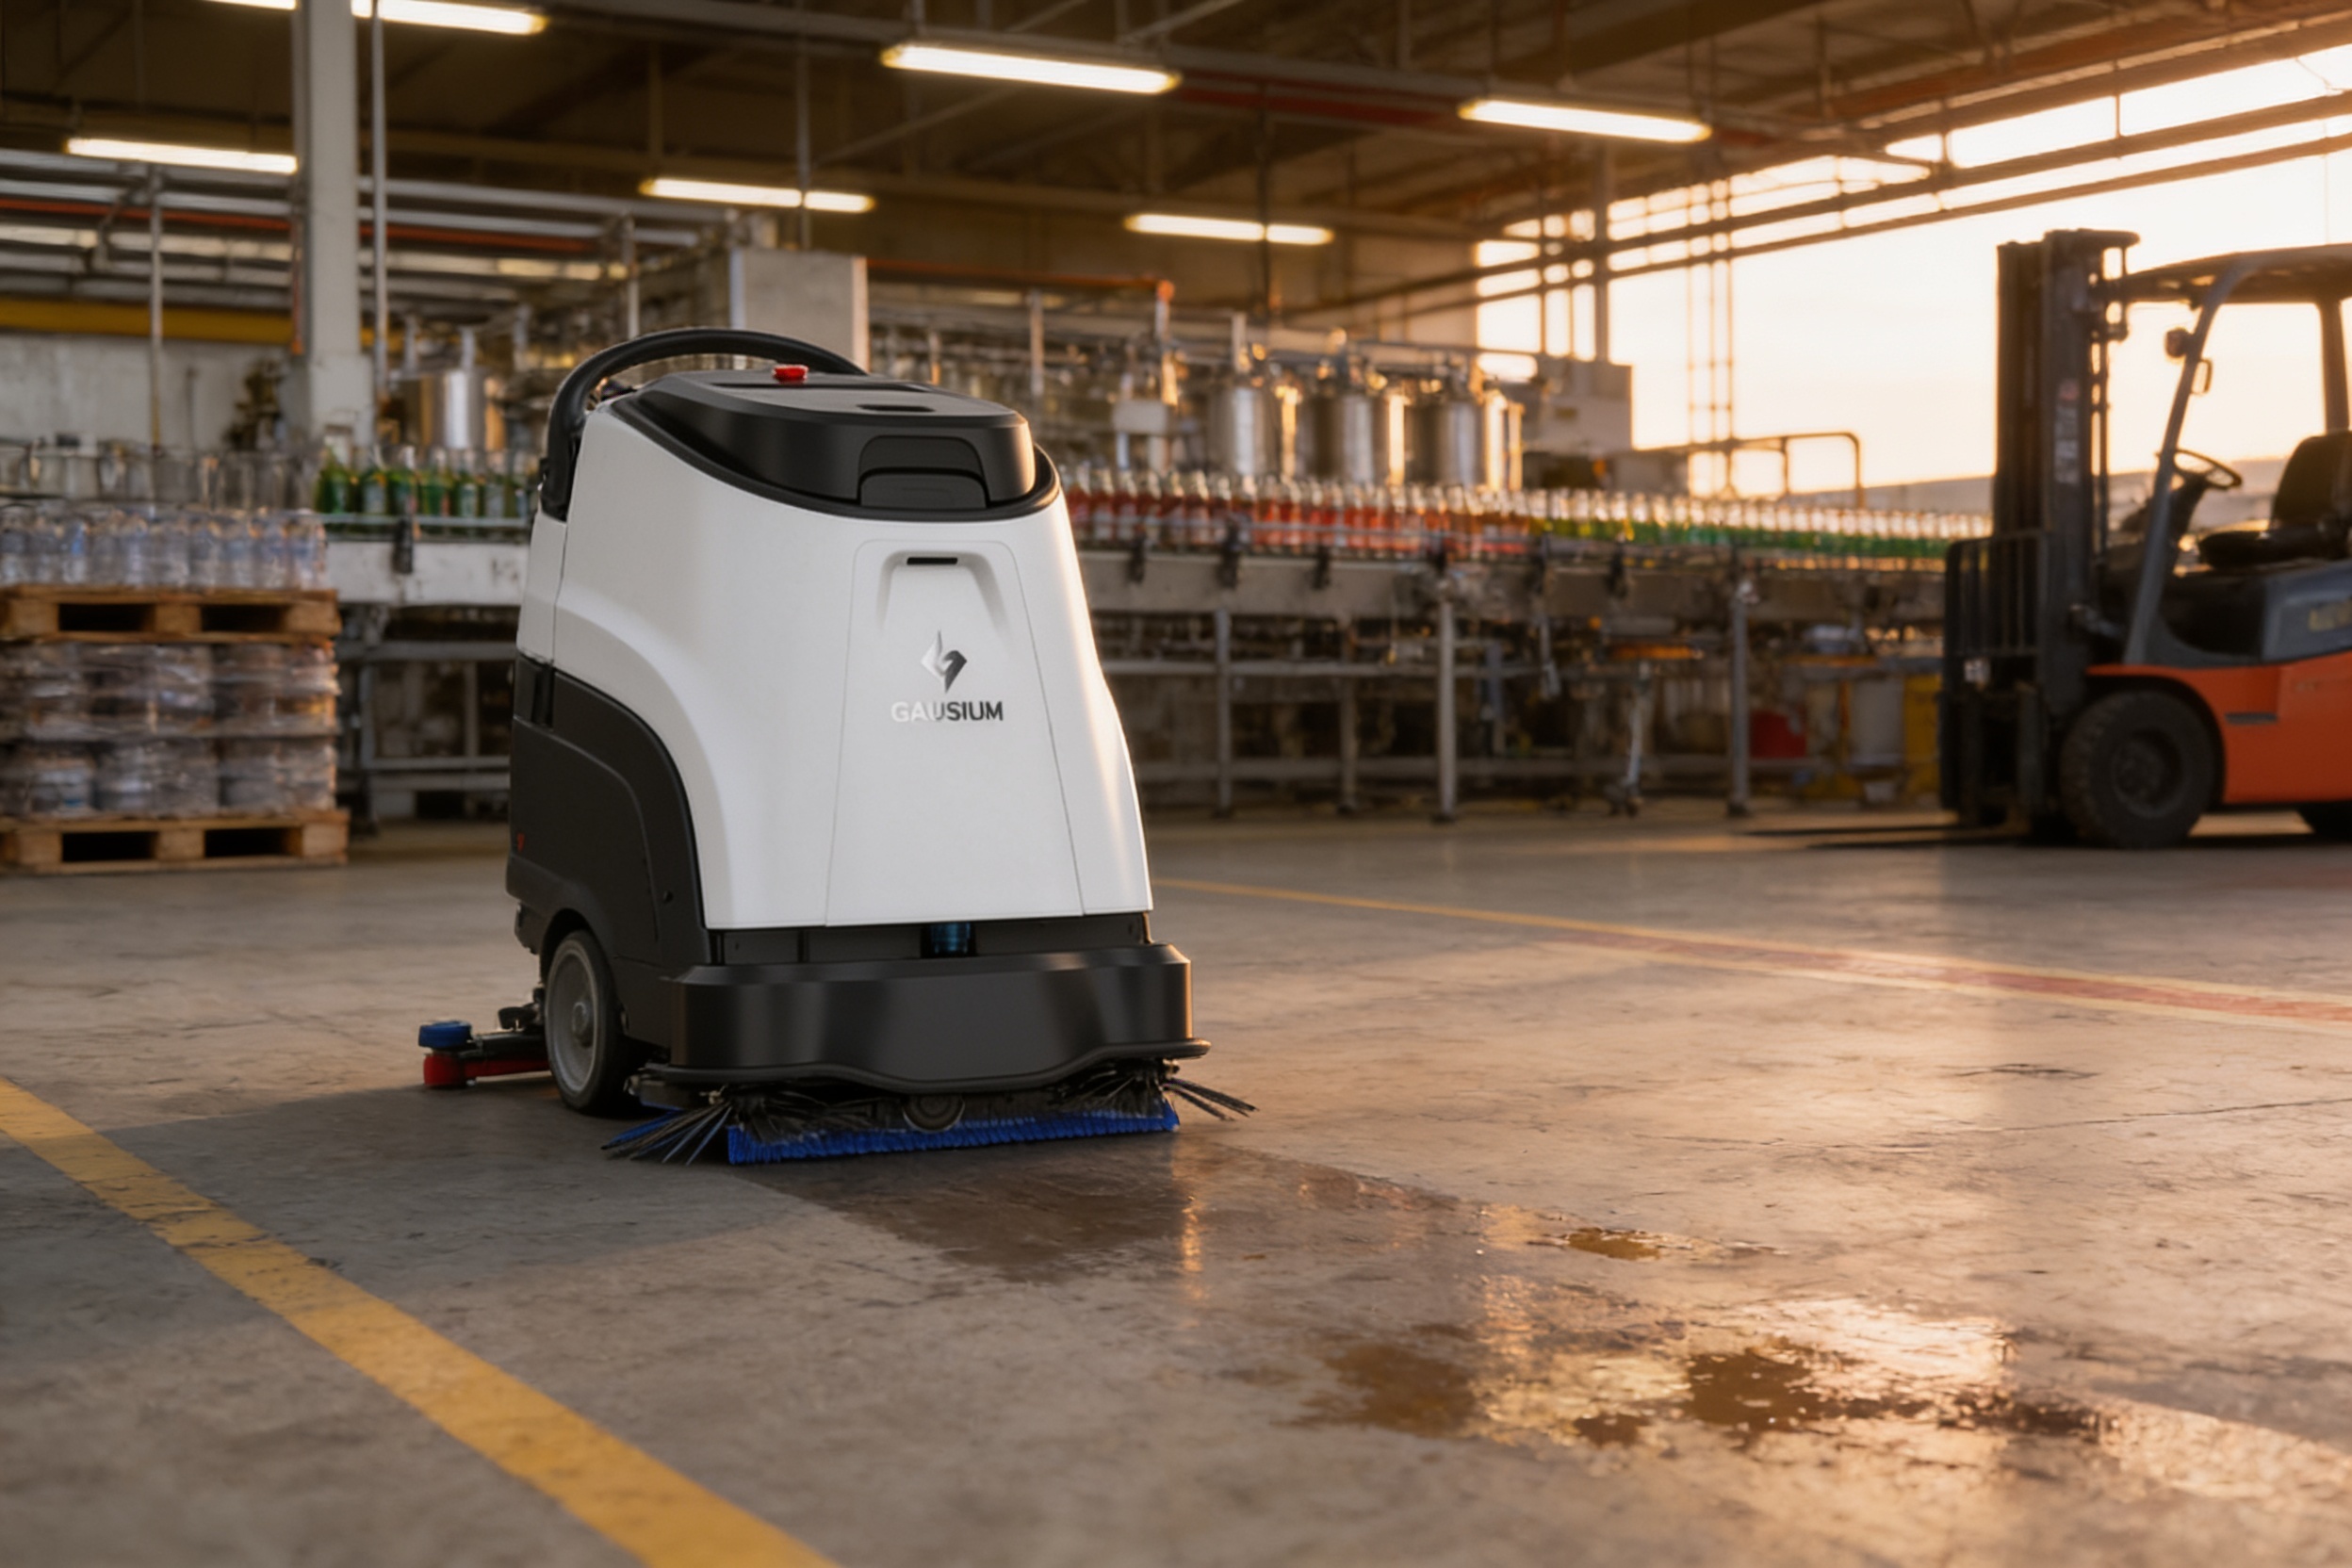
A janitorial supplier's equipment guide gives vendor-reported estimates under ideal conditions. Ride-on scrubbers with a deck of 28 inches or more cover about 35,000 to 70,000 square feet per hour. Large walk-behind machines of 20 to 28 inches cover about 20,000 to 35,000, mid-size machines of 17 to 22 inches cover about 12,000 to 20,000, and compact units cover about 8,000 to 12,000. Treat these as ceilings. Turns, stops, charging and rerouting around obstacles lower the real rate, sometimes by a lot.
For the whole task, ISSA's Anthony Trombetta, as reported in published coverage, puts an average custodian at about 2,500 to 5,000 square feet per hour with zone cleaning and 5,000 to 10,000 with team cleaning. That is a whole-task rate, not a scrubber rate, and it gives a fair pace to compare a robot against a person.
Staffing ratios give a second check. According to APPA guidance as cited in a college district article, one custodian per 15,000 to 20,000 square feet is a common standard, and the same article cites up to 25,000 square feet per school custodian. A facilities management trade article gives a national median of 28,000 square feet per full-time custodian, though the survey attribution there was not confirmed. At the common standard, an example building of about 70,000 square feet works out to roughly four custodians, which is the planning figure used for the headcount on this page.
Robot or person: where each one wins
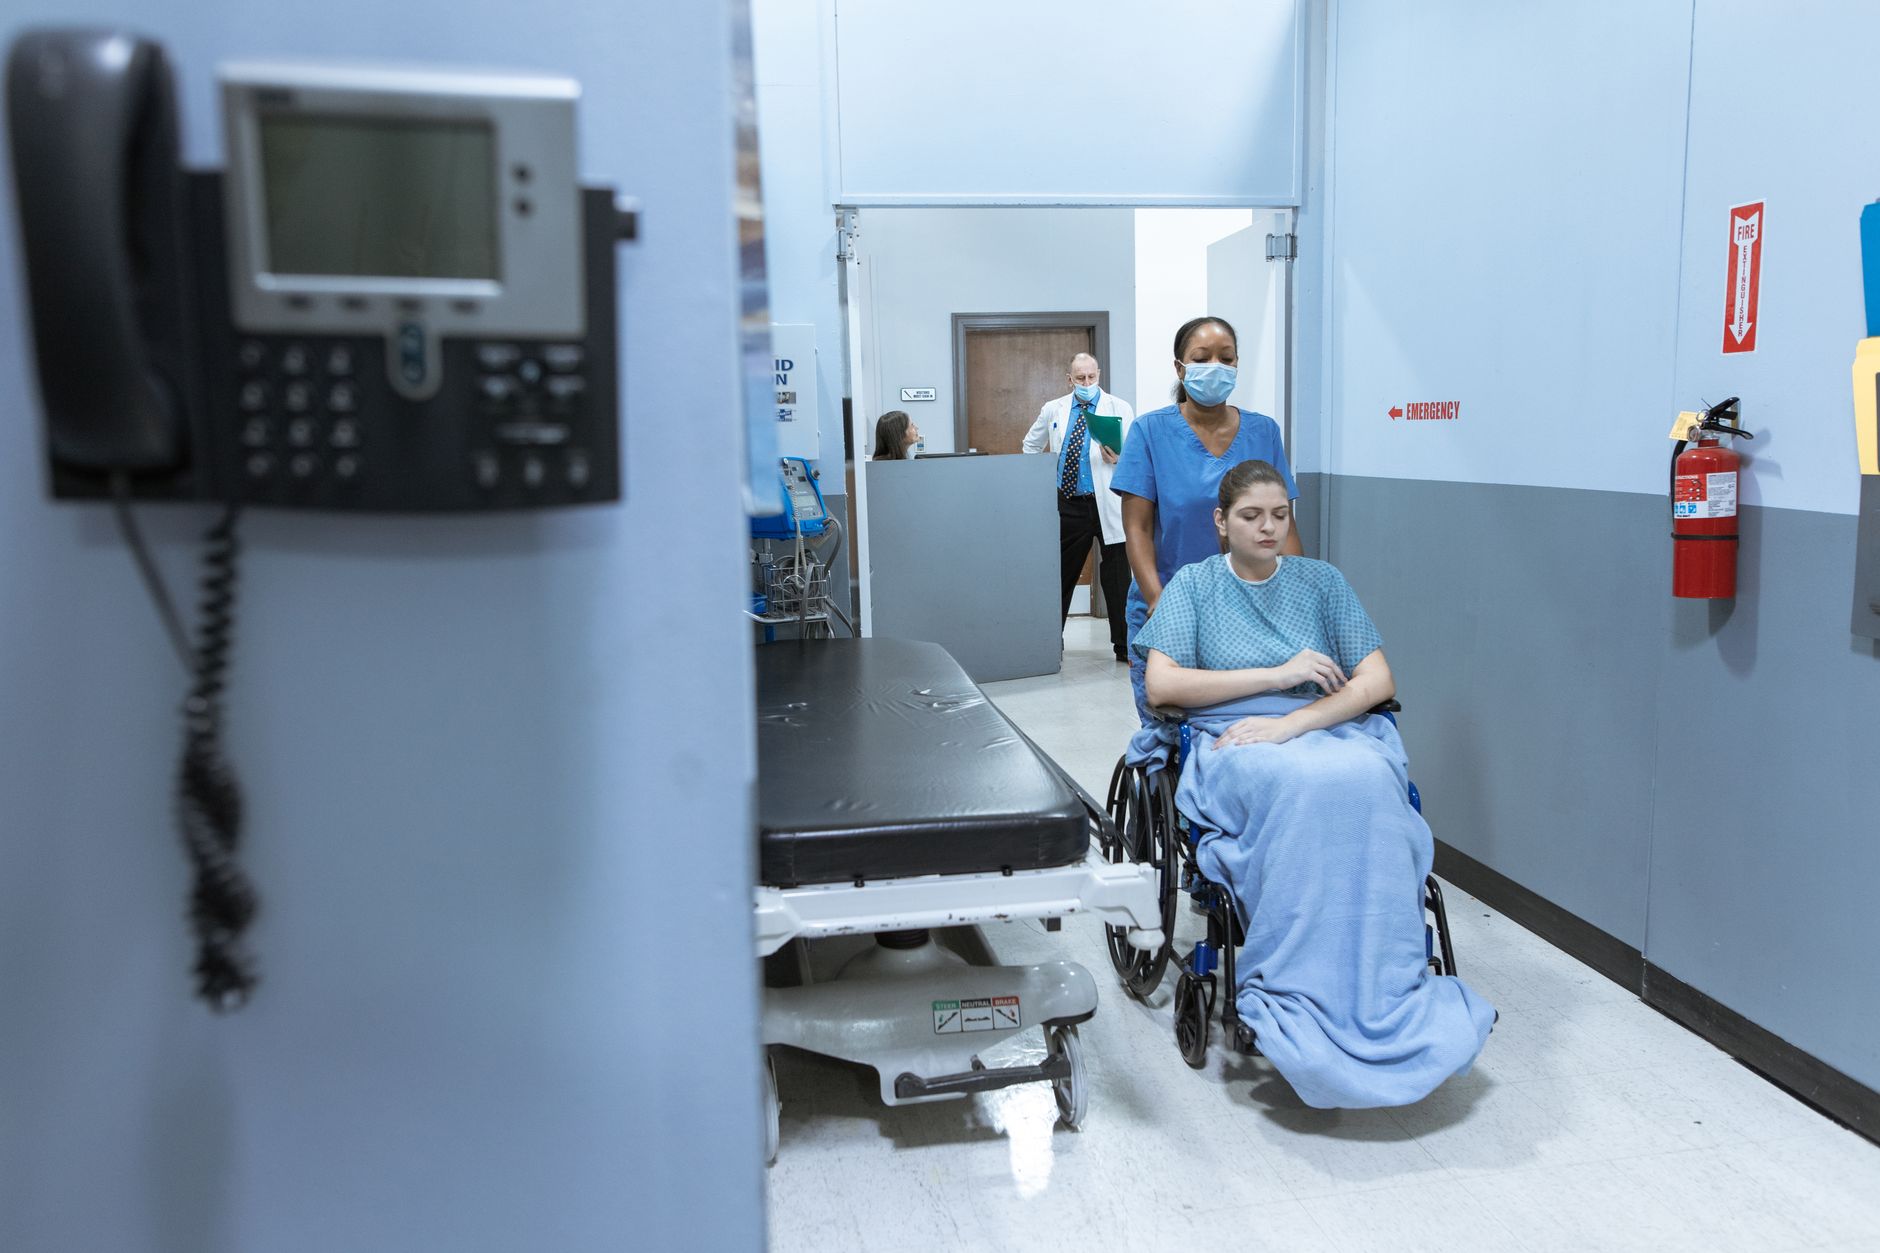
Neither wins every point. A robot holds the same route and coverage each night and works through the shift without a break or handover. People handle spills, odd corners, stairs and restrooms, and they adapt on the floor the same night when the route changes. The best results come from assigning each to the work it does well, and checking that against your shift records.
Remember the hiring side too. A person has to be recruited, trained and covered for every open shift. A robot has to be set up, mapped and maintained, and staff need training to run it. The two costs are not alike, so compare them on hours and coverage, not only on hourly labor cost.
- Night coverage
Cleaning Robot
Runs the same route on a schedule, without breaks or a shift handover
Staff
Covers the night shift and handles problems as they come up, but needs breaks and handovers
- Consistency on a repeated route
Cleaning Robot
Holds the same pass and coverage each night
Staff
Varies with fatigue, turnover and training
- Spills and unplanned cleanup
Cleaning Robot
Needs a person to stop it, clear the area and restart it
Staff
Handles the spill on the spot
- Restrooms, stairs and detail work
Cleaning Robot
Not its job, so staff keep it
Staff
Does this work
- Route changes
Cleaning Robot
Needs a trained person to remap or reprogram the route
Staff
Adapts on the floor the same night
- Staffing gaps
Cleaning Robot
Keeps its scheduled route when a shift is unfilled
Staff
A missed shift leaves the work to the people who are on duty
What are the risks to the return?
The main risk is overestimating the robot share. If staff still have to clear the route, reset furniture and do the detail work afterward, the saving shrinks quickly. Survey the route before quoting, keep the robot to floors that are clear at the start of the shift, and time the run so the robot finishes before the first occupants arrive.
Downtime is the second risk. A robot out of service on a night shift leaves the floor uncleaned unless there is a plan. Ask how service is dispatched, whether a spare unit is available, who on your staff handles a stop, and how remote diagnosis works. Get the answers in writing before you sign.
Safety needs its own line. BLS data shows the work is not low risk: according to the BLS injury and illness snapshot, janitors and cleaners logged 21,100 nonfatal injury and illness cases with days away from work in 2020, and a 2019 incidence rate of 157.4 cases per 10,000 full-time equivalent workers. Across all industries, the 2024 private-industry recordable rate was 2.3 per 100 full-time equivalent workers, down from 2.4 in 2023, according to Safety and Health magazine citing BLS. A robot reduces the hours people spend on the floor, but it does not remove trips, slips or equipment hazards on its own, so the deployment plan should cover them.
How long does it take from site assessment to payback?
The sequence runs in order: a free site assessment that maps the floor and counts the hours, a quote for the fixed lease payment, deployment and integration, staff training, then go-live with support. Payback starts when the robot takes real hours, not when the lease is signed. The timeline depends on how quickly the site is mapped and how cleanly the route runs on the first nights, so the assessment sets the schedule.
We pick the robot for the floor, lease it through financing, deploy and integrate it, train the staff and service it nationwide. A single unit is often a sensible first step, because a pilot on one floor shows the real robot share before you commit to more coverage.
To get a precise figure, request a free site assessment. We measure your square footage and route, record your shift hours and wage inputs, then return a lease quote and a savings range built on your building. Until then, the range on this page is an estimate, not a forecast.
Frequently asked questions
Put a robot to work in Boston.
We walk your site, learn the job, and recommend the unit that fits. Then we quote the lease, deploy it, and keep it serviced.
Sources
- US Bureau of Labor Statistics, Occupational Employment and Wage Statistics (OEWS May 2024)
- BLS Occupational Outlook Handbook, janitors and building cleaners
- BLS injury and illness snapshot, janitors and cleaners, 2016 to 2020
- Safety and Health magazine, report on BLS 2024 injury data
- AACEM/ISSA autonomous cleaning survey, 2019, as reported by FMLink
- Data USA occupation profile, janitors and building cleaners
- Janitorial supplier equipment guide, vendor-reported estimates
- College district article citing APPA custodial staffing guidance
- Facilities management trade article, custodial square footage median