
The short answer
Cleaning robot ROI in Birmingham, AL comes from the janitor and building cleaner hours an autonomous floor cleaner takes over, weighed against the fixed lease payment and the staff time the program still needs. The result is a range, not a promise: it moves with the hours you measure on your own floor, the share of that floor a robot can realistically cover, and the lease quote that follows a free site assessment. Vendor materials report large hour reductions, but those figures come from other sites, so the number for your building should come from your own measured baseline.
Key takeaways
- The return comes from janitor and building cleaner hours the robot takes over on your floor.
- Savings are a range set by measured hours, realistic floor coverage and the lease quote.
- Independent hour figures are thin, so measure your own night floor work before deciding.
- High turnover in cleaning jobs makes open shifts a real cost to model, not a rounding error.
- A free site assessment turns this range into a figure for your building.
Run the numbers for your site
Auto-detected from your location - we use the real BLS wage here. Not right? Pick your city or state above.
What do you want to automate?
The robot runs the open floor overnight; your crew keeps detail and edges.
What is cleaning robot ROI in Birmingham, AL?
Cleaning robot ROI in Birmingham, AL is the return a business gets when an autonomous floor cleaner takes over work that janitors and building cleaners would otherwise do. The return is counted in hours. Each hour the robot covers is an hour of floor labor that no one has to schedule, fill or supervise, and that offset is weighed against the fixed lease payment and the staff time the program still needs.
The labor side is priced on the government wage data for Janitors and Building Cleaners (OEWS May 2024, Birmingham, AL), shown in the panel beside this text. That is the local wage for this job, and it applies because the hours a robot takes are cleaning hours. If the people who mainly work your building are in another job, such as nurses or guest service staff, the robot only takes the janitorial work off their plate, and their own time is not priced into the math.
Read the result as a range. It moves with the floor hours you measure, the share of that floor a robot can realistically cover and the lease quote that follows a site assessment. A single figure on any web page, this one included, is not a figure for your building.
How much janitorial work is there nationally and locally?
According to the Bureau of Labor Statistics Occupational Outlook Handbook, there were about 2.4 million janitor and building cleaner jobs in 2024. The same source projects 2 percent growth from 2024 to 2034, which is slower than average, and about 351,300 openings a year, mostly from replacing workers who leave.
That pattern is the core of the staffing case. Growth is slow, so the work is not disappearing, but most openings are replacements, which means a site refills the same shifts again and again. A robot does not need to be recruited, trained and kept the way a person does. One vendor reported healthcare case described a night floorcare crew of 3 people, which is a single example and not an industry average.
We could not verify the May 2024 janitor employment count for the Birmingham-Hoover metro from the sources reviewed, so this page does not state a local headcount. The May 2024 Birmingham regional release from the Bureau of Labor Statistics also notes that OEWS adopted new metro definitions based on the 2020 census, so 2024 Birmingham estimates may not be comparable with earlier years. Compare the local wage in the panel with the 2024 figures, not with older releases.
Median hourly wage, Janitors and Building Cleaners
$3,447
Monthly cost of one full-time worker in Birmingham, AL, at the median wage plus payroll costs (an estimate, not a quote).
Where do the labor hours come from, and how does the math work?
The math has three parts. First, the hours the robot takes over each week, counted from the floor work your crew does now. Second, the local wage for that work, which turns those hours into labor value. Third, the cost of the program: the fixed lease payment, the staff time to load, check and log the machine, and any coverage kept for areas the robot will not handle. The return is the labor value minus that program cost, expressed as a range.
Vendor materials report hour reductions, sometimes large ones, but those figures come from other sites and from the vendors themselves, so they set no expectation for your building. Independent hour data by site type is thin in the sources we reviewed. The useful number is the one you measure. Count the floor passes, the travel between zones, the setup time and the time spent on detail work that a machine will not do.
Measure over a representative period, not a single good week. A shift that runs short, a week with an event or a month with a heavy delivery schedule will skew the baseline. The measured hours set the ceiling for the labor offset, and the share the robot covers sets the realistic figure beneath it.
| Task | Today | With a robot |
|---|---|---|
| Scrub or sweep open corridors and floors | measured on your floor at site assessment | scheduled route run, with a staff check at start |
| Clear the route before each run | staff time, measured at assessment | staff clears loose items and cords before the run |
| Detail work and spot cleaning | measured on site | stays with staff |
| Restrooms and high-touch surfaces | measured on site | stays with staff |
| Logging, checks and reporting | measured on site | staff log checks and report faults |
Hour figures come from your own measured baseline at the site assessment. Vendor materials report hour reductions, but those figures come from other sites and are not applied in this table.
How much of the floor work can a robot realistically take?
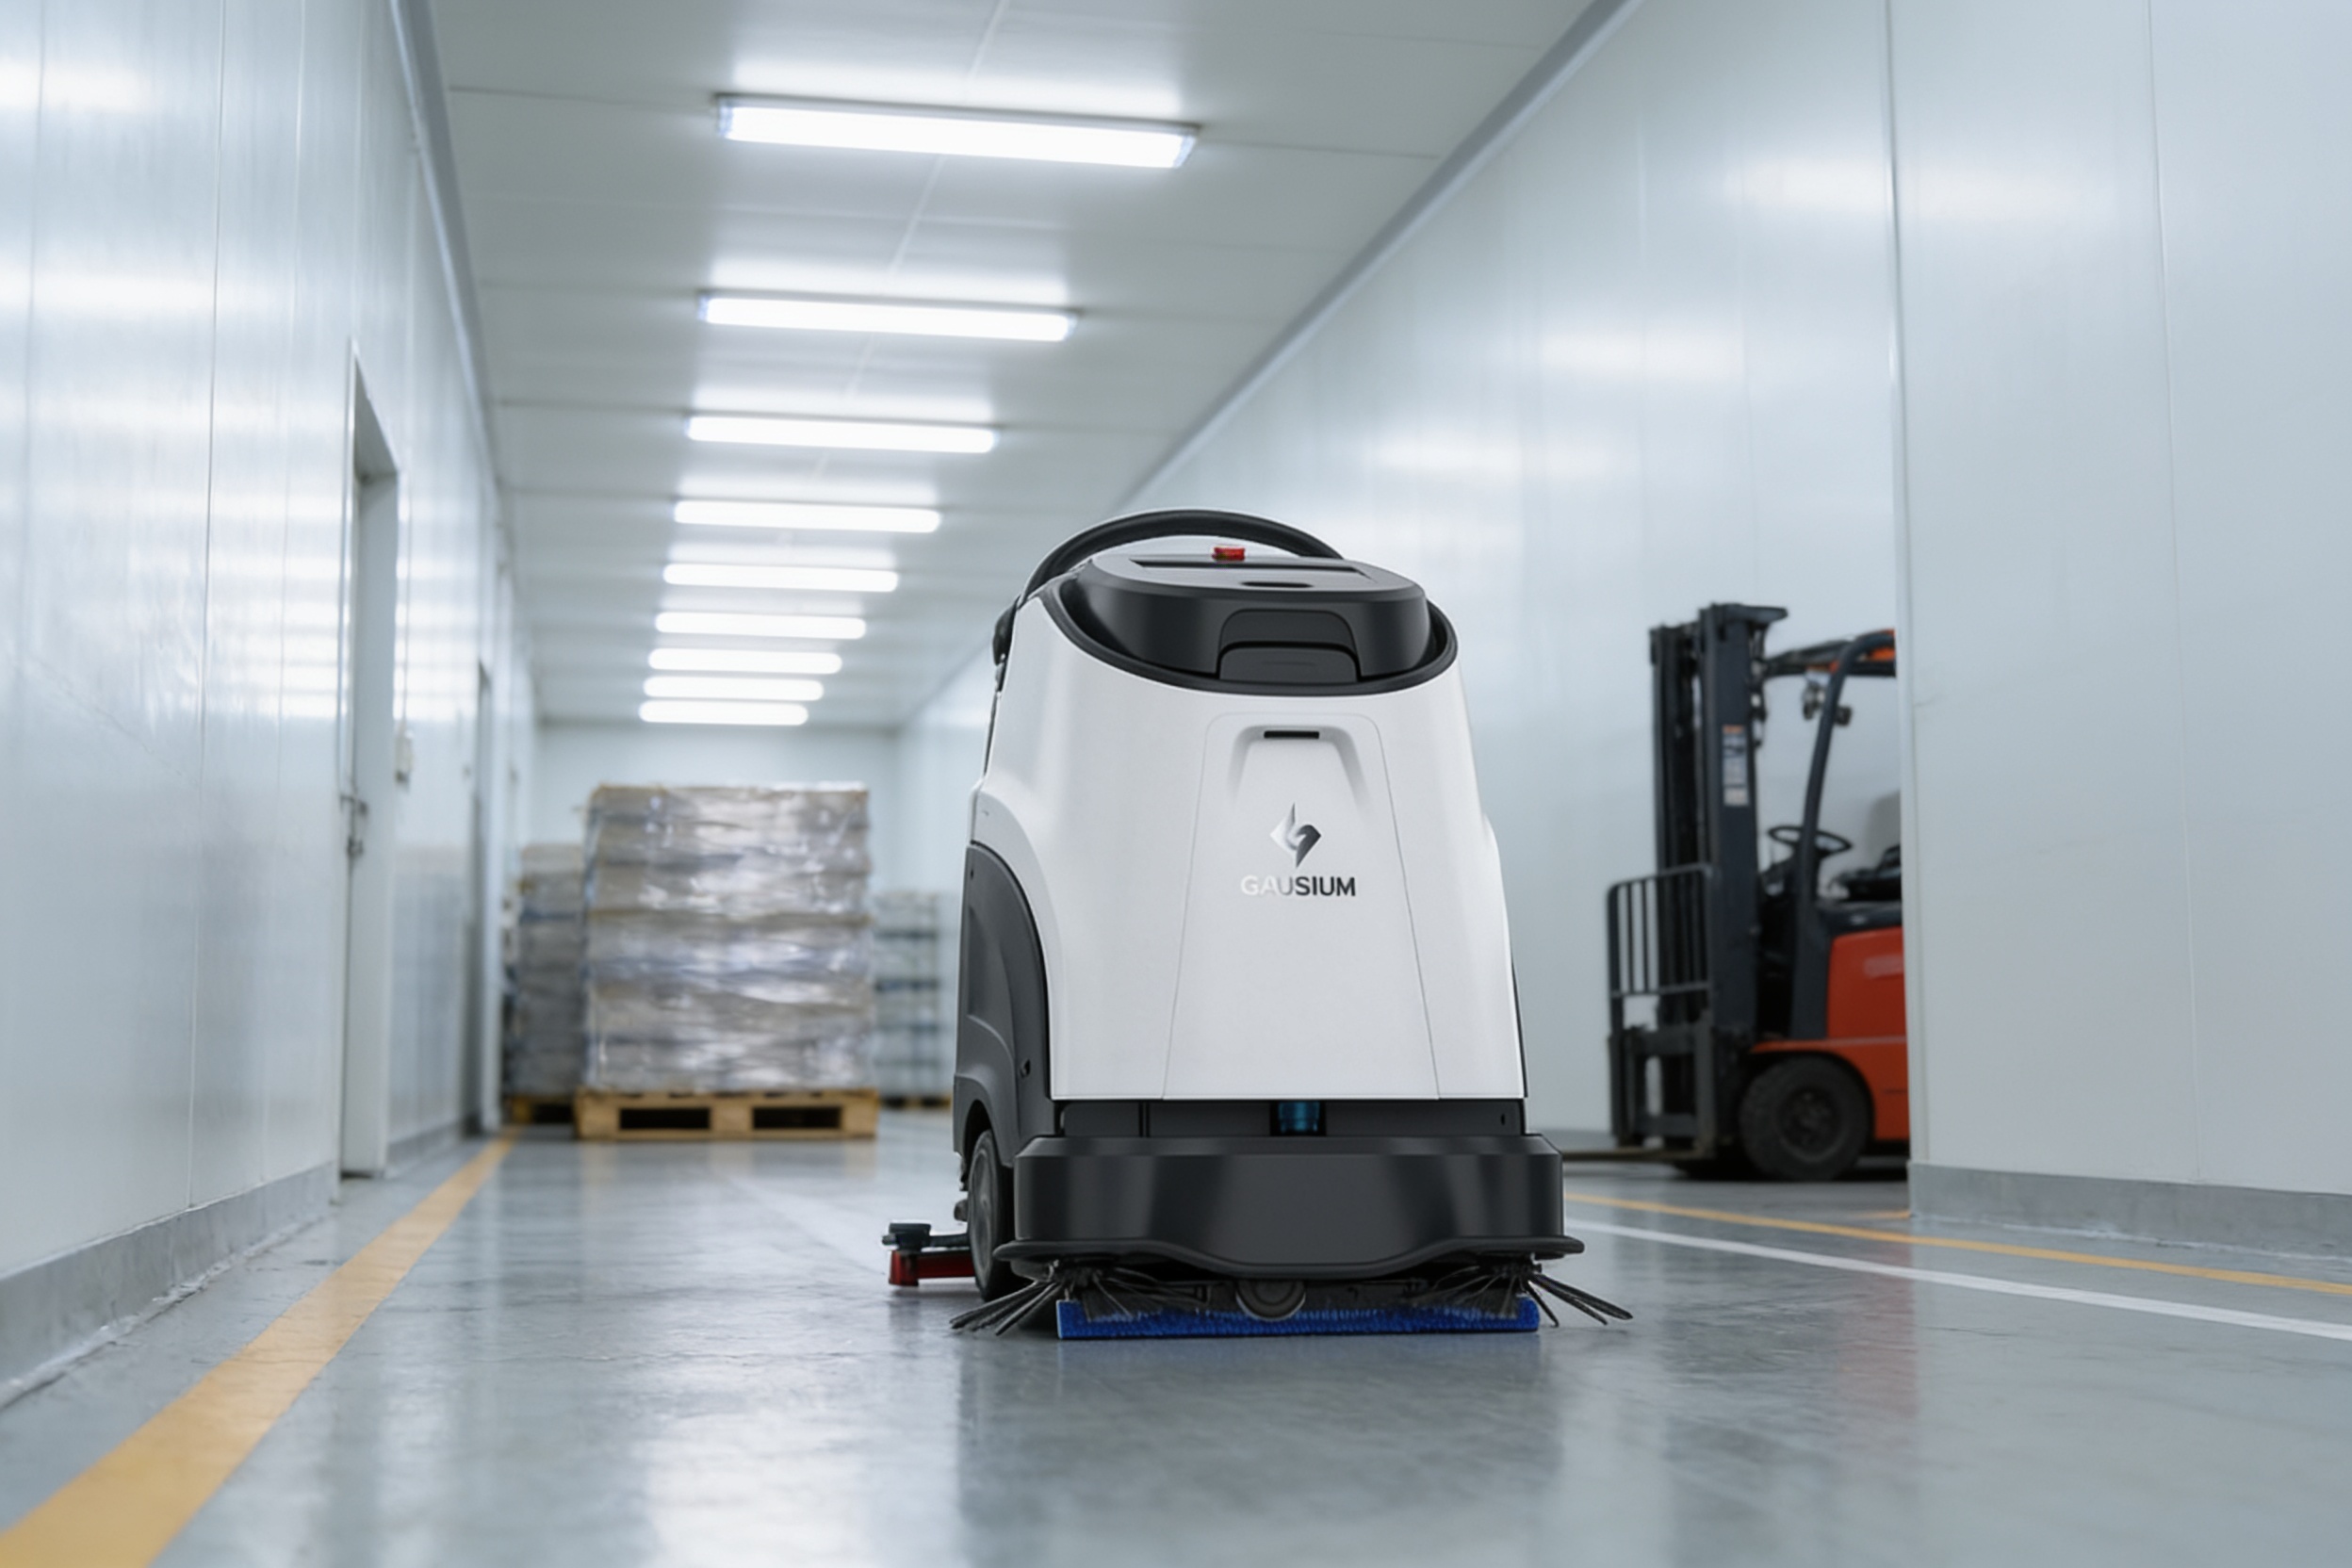
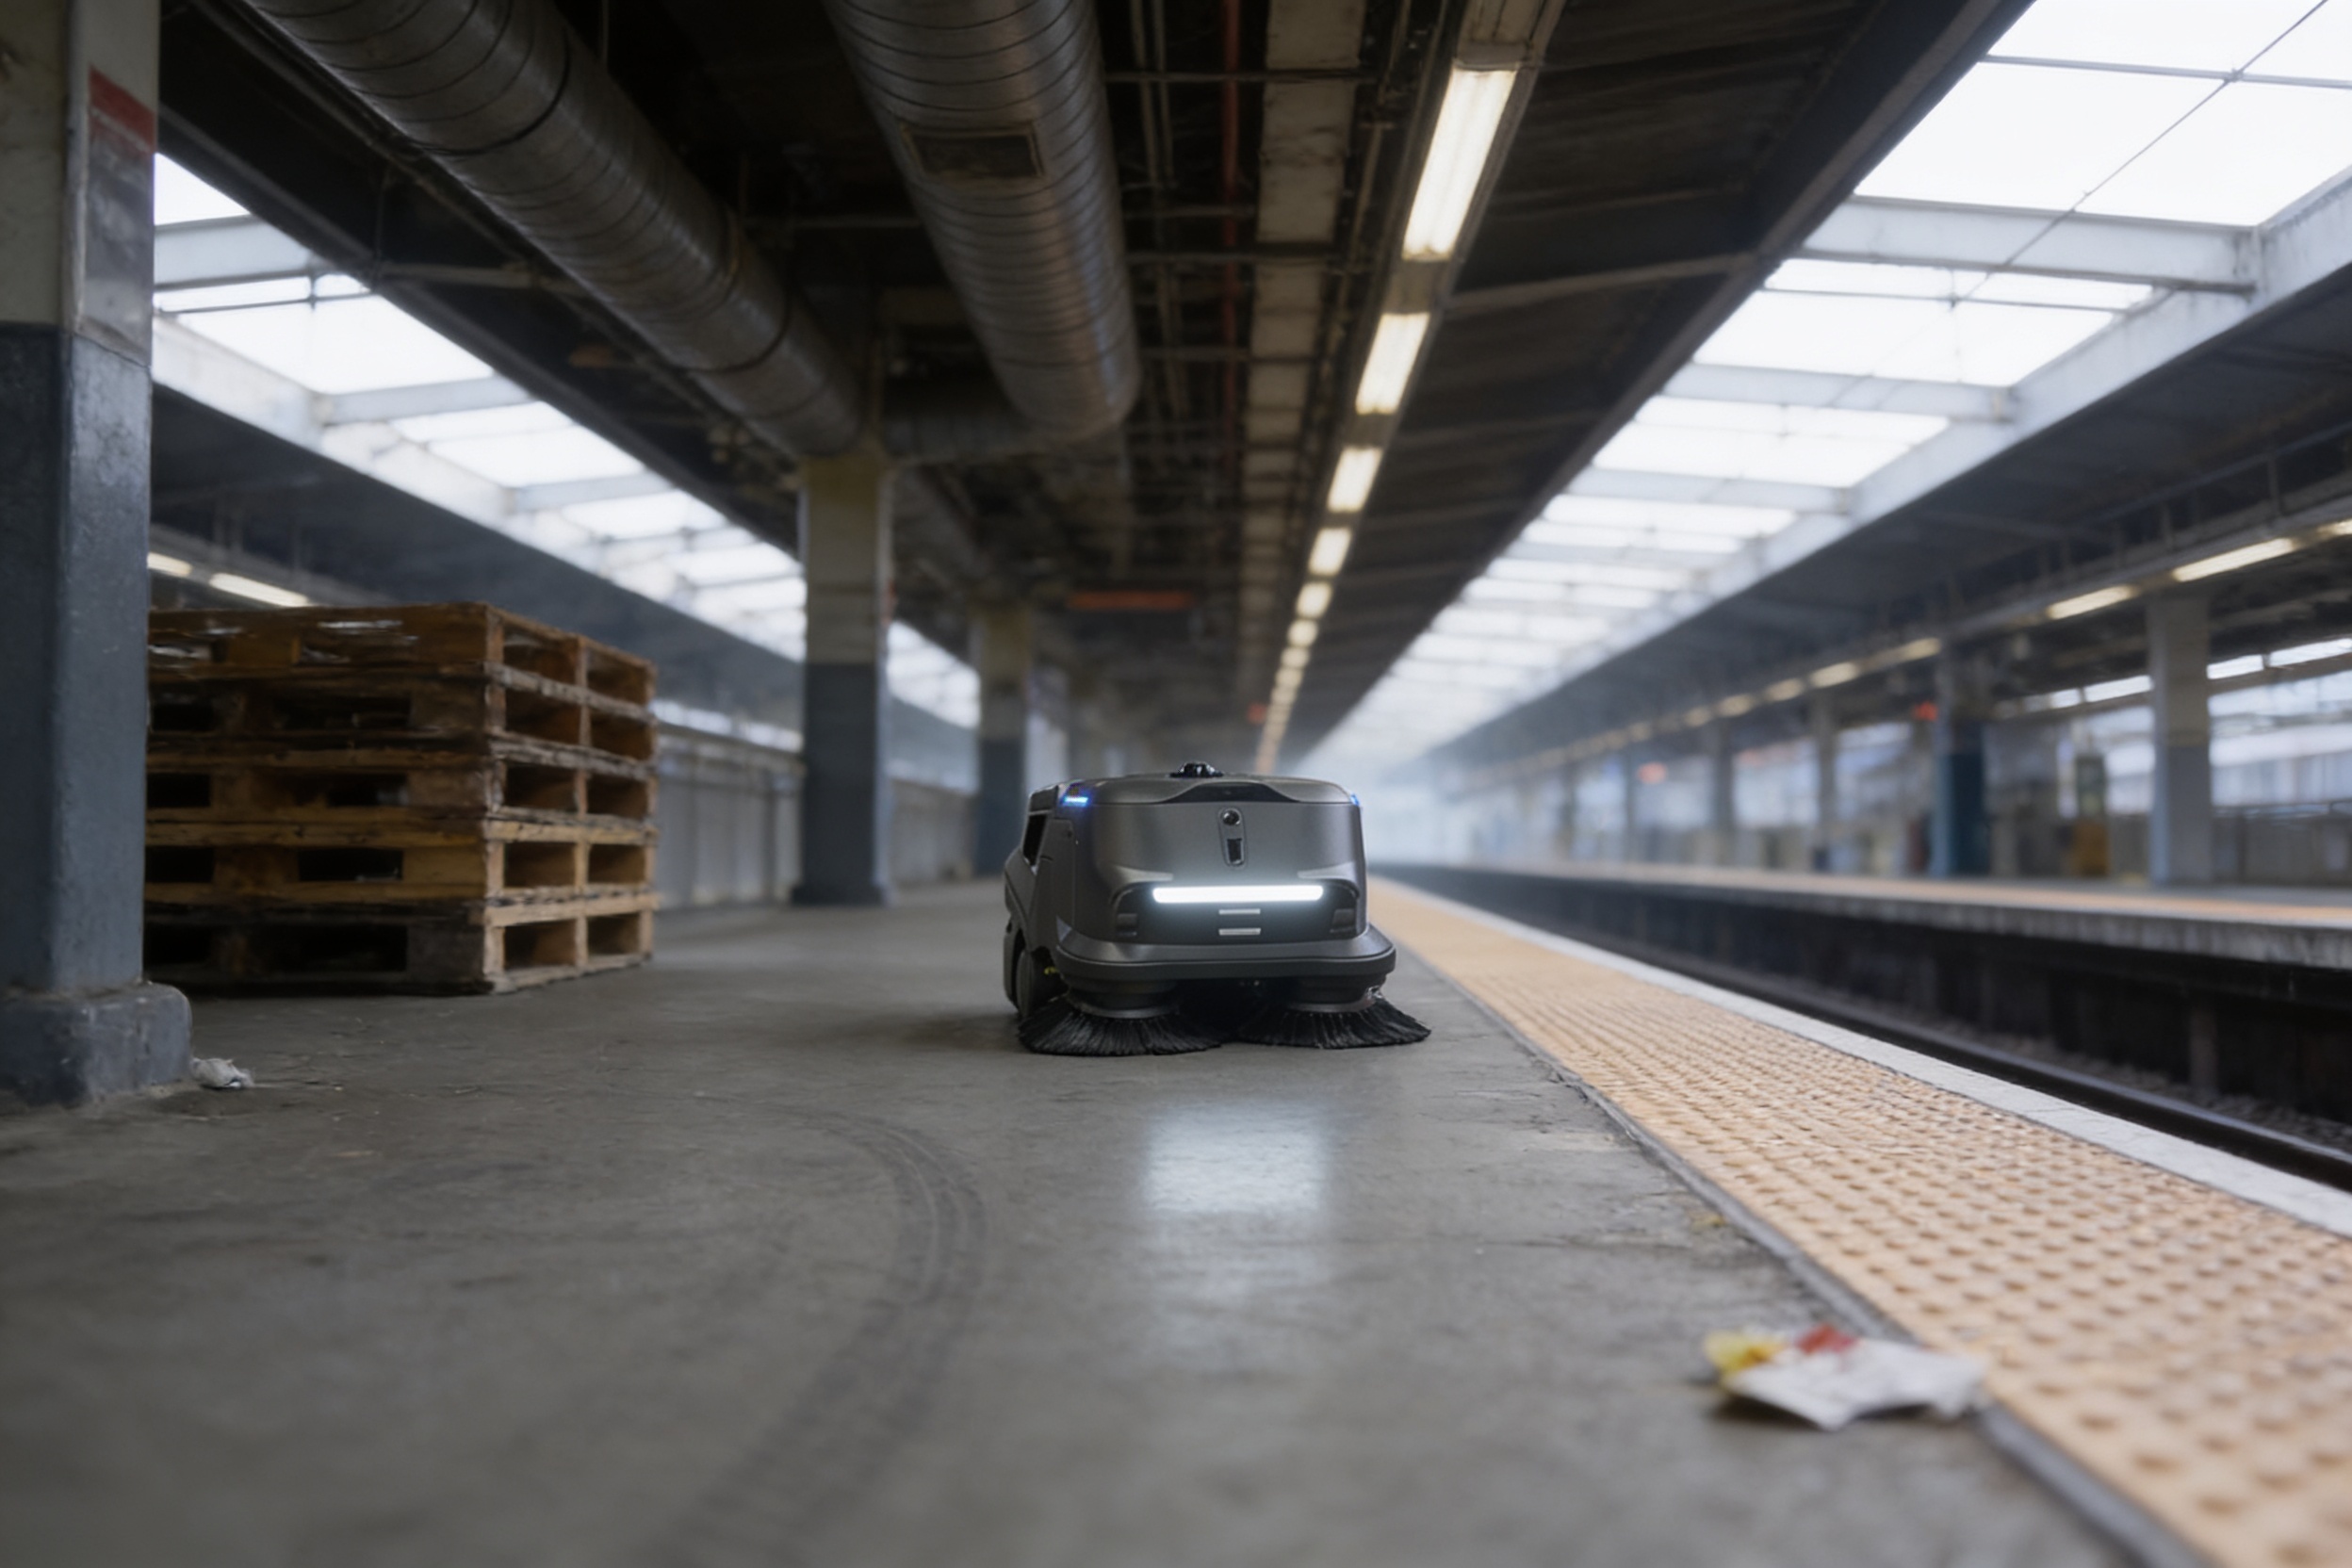
Not all of it. A robot covers open, reasonably clear floor well. It struggles with furniture that moves, tight corners, thresholds, steps and spots that need hand work. Realistic coverage is the share of the janitorial task list that is open floor, repeated and predictable. On many open floors that is the largest part of the hours, and the detail work stays with people.
Adoption data helps set expectations. A 2019 autonomous cleaning survey by a cleaning trade association and an industry research group drew 250 completed responses from nearly 23,000 contractors, in-house providers and facility managers contacted, with a 6 percent margin of error at 95 percent confidence. According to that survey, about 27 percent of respondents used autonomous cleaning equipment. Among those adopters, 89 percent used scrubbers, 46 percent used vacuums and 32 percent used large-area sweepers, which points to floor scrubbing as the most common first use.
The survey is seven years old and its full report is limited to members, so treat its shares as a snapshot of the market, not a forecast for your site. Areas that look like open floor on a plan can still hold furniture, stock or cords that change the route each night. Walk the route before you estimate coverage.
How do staffing gaps and turnover change the return?
Turnover is where many cleaning budgets leak. An HR software publisher's 2026 summary of Bureau of Labor Statistics JOLTS data says janitorial and cleaning occupations regularly exceed 50 percent annual separation. A 2026 statistics compilation attributes to a cleaning trade association a 42 percent annual turnover figure and a 76 percent share of cleaning firms reporting labor shortages, both for 2023. The compilation is secondary, so use these figures as direction, not as a benchmark for your site.
Turnover shows up in the return in two ways. Each open shift is labor you pay for through overtime, agency staff or missed coverage, and each new hire needs training before they are productive. A robot that runs the floor on a fixed route reduces how often those gaps reach the schedule. It does not remove the need for a person to check, load, clear and log the machine.
Model the gap honestly. If your site has been short for months, count the unfilled hours as coverage you are missing, not as savings you already have. If your staffing is steady, the return rests almost entirely on the hours the robot takes over.
- Night coverage
Cleaning Robot
Runs the scheduled route with no open shift to fill, once the route is clear.
Staff
Covers the shift only if someone is hired, trained and present.
- Detail and spot work
Cleaning Robot
Covers open floor, not corners, spills or fixtures that need hand work.
Staff
Handles corners, spills, restrooms and fixtures with judgment.
- Adapting to change
Cleaning Robot
Struggles with moved furniture, new stock or blocked paths until the route is reset.
Staff
Adapts on the spot to moved furniture, spills and new obstacles.
- Consistency of passes
Cleaning Robot
Repeats the same route each run without fatigue.
Staff
Varies with attention and fatigue, but can notice what a route misses.
- Training and onboarding
Cleaning Robot
Needs setup, route mapping and staff training before go live.
Staff
Needs onboarding and supervision, and turnover means repeating it.
- When something fails
Cleaning Robot
Stops and needs staff or on-site dispatch to restore the route.
Staff
Calls in sick or leaves, and the shift needs cover.
What is the lease, and what moves the number up or down?
We lease the robot through financing, with no upfront capital requirement. The fixed lease payment is quoted after a free site assessment, so the number reflects your floor, your hours and your term. The service plan covers maintenance and repair, with on-site dispatch and remote triage nationwide. Where the site cannot tolerate a stopped floor, a spare unit under a backup program can be scoped into the lease.
Several things move the number. Clear paths and open floor raise the share of hours the robot covers. Many small rooms, stairs and frequent furniture moves lower it. Shift timing matters too: a unit that runs in an overnight window frees the day crew, while one that runs during busy hours competes with people for the same floor and needs a different plan.
Starting with one unit lets you measure real hours before you scale. A phased start also shows where the route needs changes, so the quote for additional units rests on logged data rather than on the first estimate.
What are the risks to the return, and how do you avoid them?
The most common risk is assuming the robot covers more floor than the map shows. Plan on the coverage you measured, not the coverage a brochure implies. A second risk is a site that changes often, such as one with frequent event setups or stock moves that block the route. A third is an idle machine. An unused robot earns nothing, so the program needs a named owner who checks it each shift.
Injury exposure belongs in the math too. A summary from an outside aggregator of Bureau of Labor Statistics injury data reports janitorial services at 2.5 total recordable cases per 100 full-time workers in 2024, against 2.3 for private industry overall. That summary has not been checked against the BLS table itself, so use it as a prompt to review your own injury log. Machines can reduce how much heavy manual scrubbing a person does, but they do not remove the need for safe loading and handling.
Avoid these risks by asking for a site map, a measured hour baseline, a written service response time and a backup plan before you sign. A sound quote states what the robot covers and what staff still do. If a proposal cannot say which zones it will skip, treat that as a warning.
What is a realistic timeline from assessment to payback?
The sequence runs from a site assessment to a written quote, then deployment, a go live period and a measured payback view. The assessment maps the floor, measures the hours your crew spends now and identifies where the robot will run and where it will not. The quote follows the assessment, and the lease begins only after you accept it.
Deployment covers integration with the building, including charging location, network needs and any doors or elevators the route uses. It also covers staff training and a go live period with support on site. During that period the crew compares the robot's logs and covered hours against the baseline from the assessment.
Payback can only be judged once enough real shifts are logged to compare with the baseline, so the timeline depends on the site and on how quickly the baseline holds. We do not promise a fixed timeline before the assessment, because the floor, the access rules and the staffing decide it. A phased start with one unit gives you real hours early, which is the most direct route to a dependable cleaning robot ROI in Birmingham figure for your building.

How do you get a precise figure from a free site assessment?
A free site assessment turns this page's range into a figure for your building. We map the floor, identify the zones the robot will cover, measure the hours your crew spends on that work and note the parts that stay with people. We also review the route, power, network access and any doors or elevators the robot would use.
We are a commercial robot integrator. We pick the robot for the site, lease it through financing, deploy and integrate it, train your staff and service it nationwide. We stay vendor neutral in the selection, so the unit is matched to your floor, and you deal with one team for deployment, service and dispatch.
The output is a written quote showing the fixed lease payment, the hours the robot is expected to cover, the staff time it still needs and the savings range those numbers support. To speed the assessment, bring floor plans, the shift schedule and any injury or turnover records you already keep.
Frequently asked questions
Put a robot to work in Birmingham.
We walk your site, learn the job, and recommend the unit that fits. Then we quote the lease, deploy it, and keep it serviced.
Sources
- US Bureau of Labor Statistics, Occupational Employment and Wage Statistics (OEWS May 2024)
- Bureau of Labor Statistics, Occupational Outlook Handbook, Janitors and Building Cleaners
- Bureau of Labor Statistics, Birmingham metro occupational employment and wages release, May 2024
- Cleaning trade association autonomous cleaning survey overview, 2019
- HR software publisher summary of BLS JOLTS cleaning turnover data, 2026
- Secondary cleaning industry statistics compilation, 2026
- Outside summary of BLS injury data for janitorial services, 2024 (not checked against BLS)