
The short answer
Cobot ROI for dental labs comes mainly from taking repetitive polishing and finishing passes off technicians, which frees skilled hours for the detailed shaping that still needs a person. The return depends on how many restorations follow a consistent finishing pattern, how many hours of that work a week carries, and the fixed lease payment, so the savings figure is a range until a site assessment measures your own bench.
Key takeaways
- The return comes from repetitive polishing and finishing hours, not from the detailed shaping technicians keep.
- The calculator prices robot hours at the government wage for laborers and freight, stock, and material movers, hand, never at technician pay.
- Savings are ranges, and a site assessment times your own finishing hours before any lease is quoted.
- Hand and arm strain from handpiece and grinding work is a health reason to look at automation, separate from the wage math.
- Payback depends more on part mix and exceptions than on the arm itself.
Run the numbers for your site
Pick your city or state for a real regional number - we use the real BLS wage there. (On the live site this auto-detects from your location.)
What do you want to automate?
The cobot stacks the repetitive end-of-line pallets; your team handles changeover and QA.
Where does cobot ROI for dental labs come from?
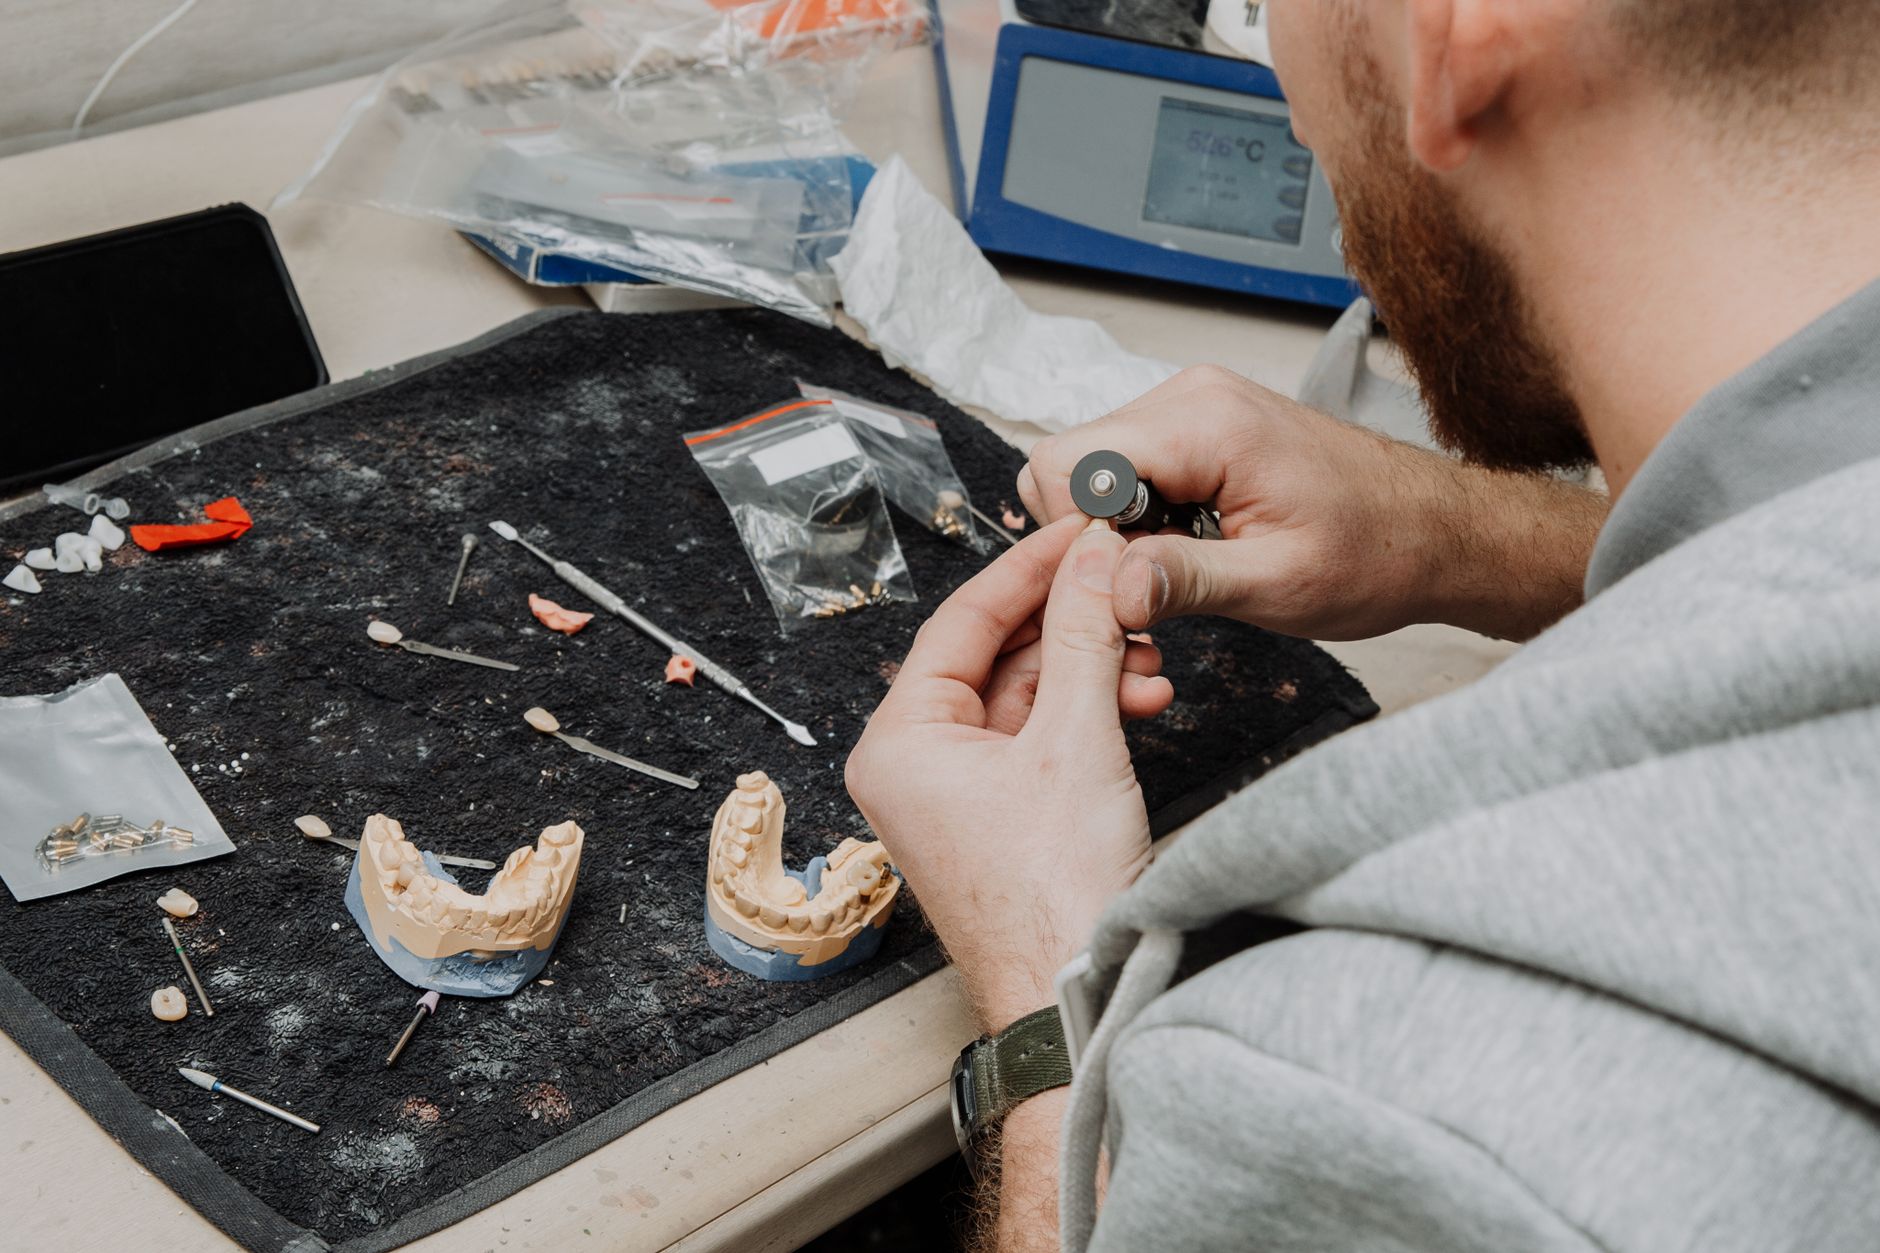
A dental lab turns impressions and scans into crowns, bridges and appliances, and a large share of the bench time goes to finishing. After milling, casting or printing, each restoration gets its margins smoothed, its surface polished and its contours checked, often over and over. Many of those passes follow the same motion on the same geometry, which is the kind of repeat work a collaborative robot arm can run at a fixed station.
The return comes from the hours that pattern takes. When the arm runs consistent passes, technicians spend less time on repetitive finishing and more on the detailed shaping, contact and bite adjustment and quality checks that still need a trained hand. The point is not to cut the bench. It is to move skilled hours toward work where judgment matters.
How many dental labs are there in the US, and is the market shrinking?
According to a 2026 market research count of US dental laboratory businesses, the industry had 4,375 businesses, down 0.7 percent from 2025. The same count shows business numbers falling about 1.6 percent a year on average from 2021 to 2026.
The trend is useful context for the market, but it does not decide whether one building has enough repeat finishing to keep an arm busy. That is a question for the floor, and a national count cannot answer it. Treat any national total as background. The useful number is the finishing hours inside your own lab, which the assessment measures directly.
Median hourly wage, Laborers and Freight, Stock, and Material Movers, Hand
$4,380
Monthly cost of one full-time worker, at the median wage plus payroll costs (an estimate, not a quote).
How many people do this work, and how many are there?
The occupation that does most finishing is dental laboratory technicians, and the Bureau of Labor Statistics tracks it by metro area. Its occupation page, labeled May 2023, lists 440 jobs in the Buffalo-Cheektowaga-Niagara Falls metro and 100 in Olympia-Tumwater. Those are regional counts, so they show where the work sits, not how many people any one lab employs.
A secondary summary of Bureau of Labor Statistics data projects a change of minus 4.7 percent in employment for this occupation from 2024 to 2034. Because it is a secondary reading, confirm it against the government source before you put it in an internal memo. Staffing is also hard to hold. A 2024 conference paper on dental technician laboratories, from Bulgaria and not US data, found that low pay was the top turnover factor cited by technicians, at 69.84 percent. Its sample is not described in the excerpt, so treat it as a signal, not a rate.
No verified survey gives a typical headcount for one lab. As a rough check, a national technician count from a third-party employment estimate, year not stated, divided by the number of labs gives about 8 technicians per lab. Use that as a planning placeholder, then count your own bench during the assessment.
Which parts of the lab can a cobot actually work in?
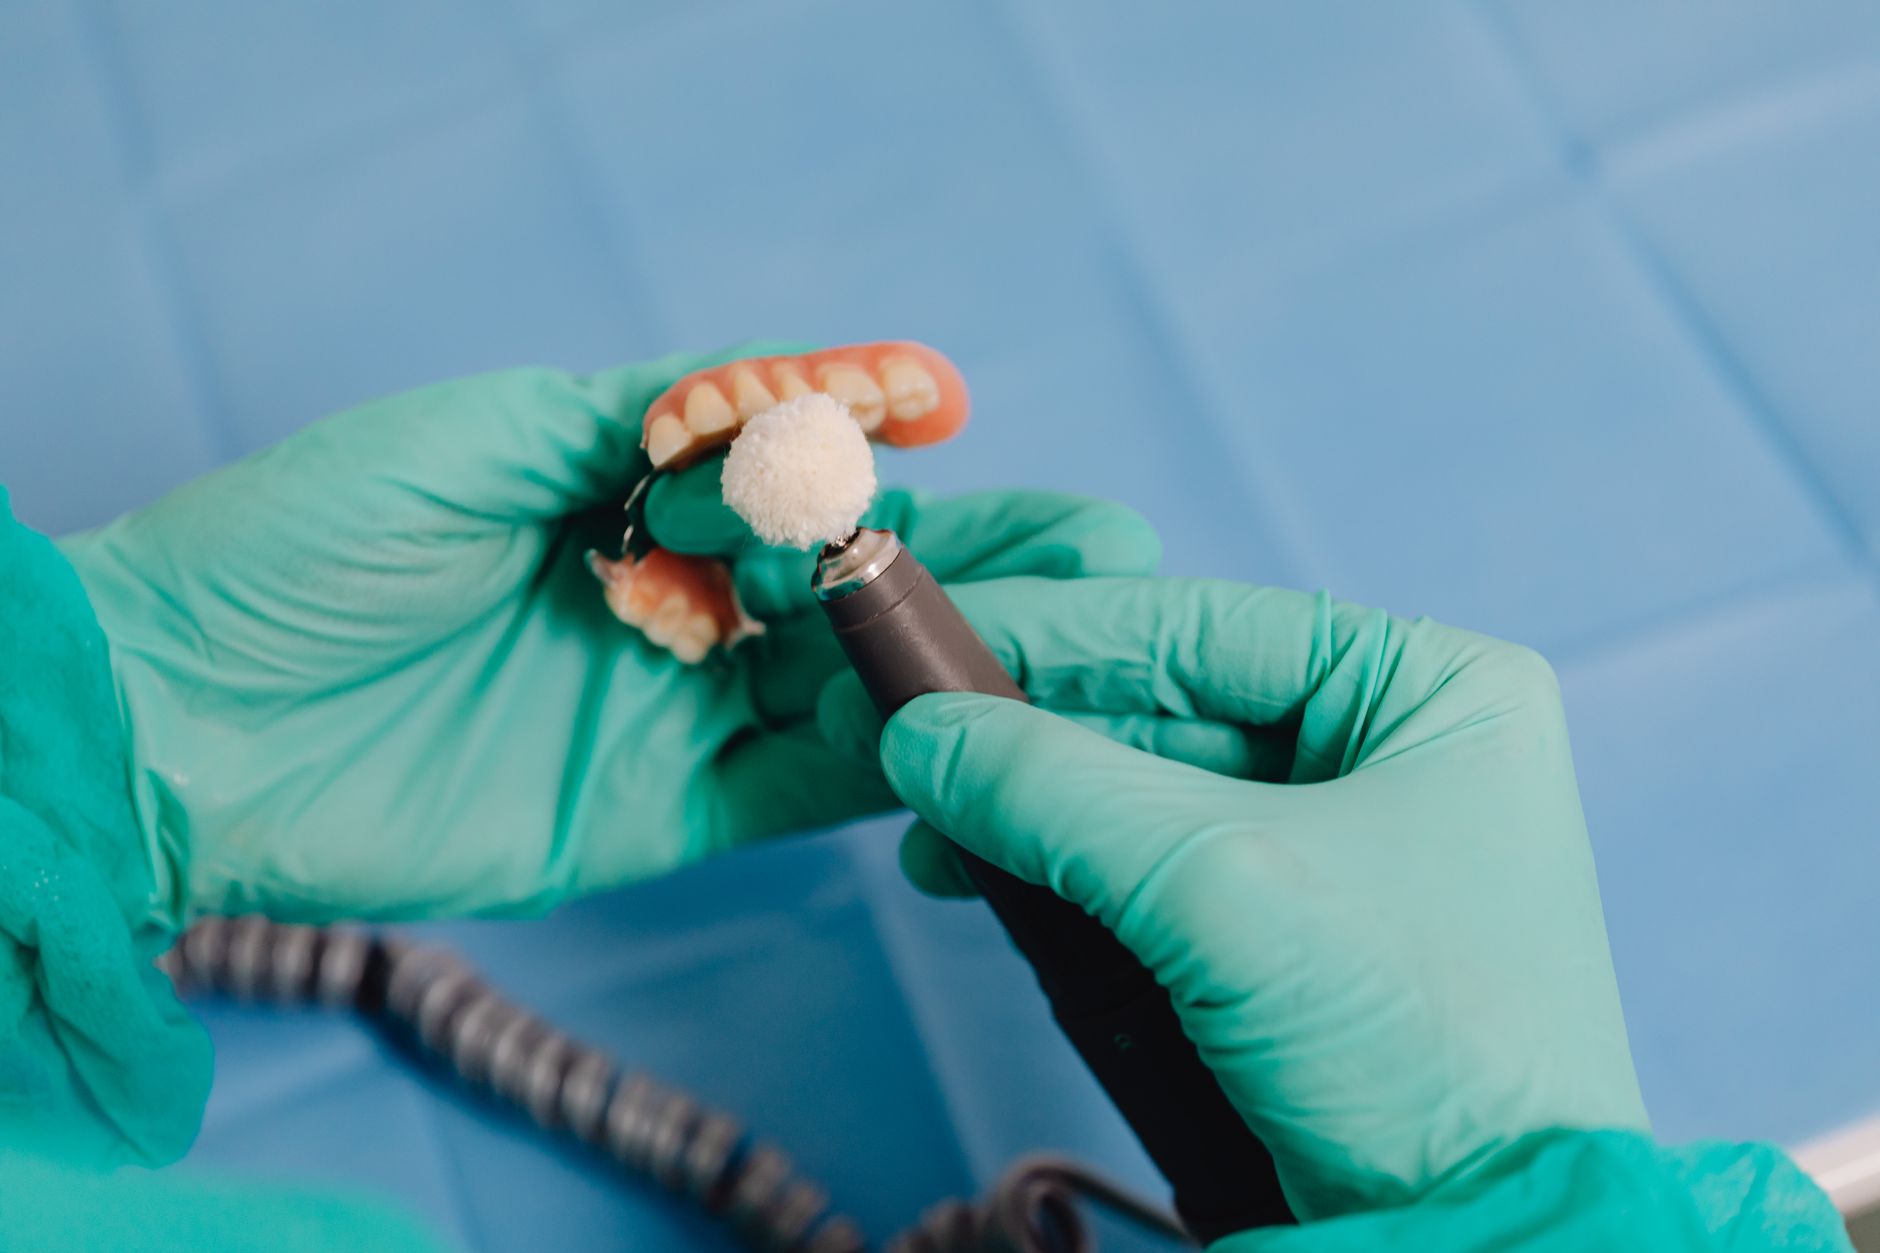
A cobot does not run the whole lab. It works at a fixed station with a set fixture, a tool and a defined path, so the best candidates are stations where the same motion repeats. In a dental lab that usually means the post-mill finishing bench, the polishing station and the appliance finishing area. Work still moves between stations by hand, so the return is highest where a batch flows through one cell.
A vendor case study of a large US dental lab group describes arms that tend crown-milling machines. The arms pick crown blanks from shade dispensers, load the mills, and move finished parts to a conveyor after a 10-minute milling cycle. That is tending, not polishing, but it shows the pattern: a fixed station, a repeat cycle and a person who handles exceptions.
The same vendor says force sensing lets the arms work without fencing after a risk assessment. Treat that as a claim to test. Guarding decisions depend on your layout and local rules, and your own safety review decides which applies on your floor.
How does the savings math work?
The calculator on this page runs in three steps. It first counts the hours of repetitive finishing and polishing a site runs in a typical week. It then applies the share of that work a robot realistically takes over, which is usually less than all of it because parts vary and some passes need a person. Last, it subtracts the fixed lease payment and the service costs, and shows what is left as a range.
The labor side is priced in hours at the government wage data shown in the panel next to this text, for Laborers and Freight, Stock, and Material Movers, Hand. The savings figures are built on that wage because the robot takes laborers and freight, stock, and material movers, hand type of work off the technicians' plate. The model does not price a technician's own time. Skilled judgment still matters, and it stays on the bench.
Read the range carefully. The low end assumes few parts fit the pattern and the high end assumes most do. A practical test is to time one normal week of finishing, sort it into repeatable and one-off work, and compare the repeatable hours with the total before anyone asks for a figure.
What changes the return up or down?
Four things move the number more than anything else: how repetitive the parts are, how many hours a week the finishing pattern takes, how much setup a batch needs, and how often the cell stops for a part it cannot handle. A lab that mostly makes one-off restorations sees a narrower range than one running long batches of standard crowns.
Staffing shifts the picture too. A lab that cannot fill finishing shifts gets more from the robot, because its hours cover work that would otherwise wait. A fully staffed lab gains mainly freed skilled time, and that gain is real but harder to put a number on.
What are the risks to the return, and how do you avoid them?
The first risk is overstating the share of work a robot takes. Restorations vary, and a cell that handles standard cases well can struggle with unusual margins or new materials. Avoid it by piloting one station on a defined part family before scaling, and by writing down which cases go back to a technician.
The second risk is health, and it is one reason labs look at automation at all. A 2024 case report from Singapore describes a 39-year-old technician with five years in a fabrication lab who developed bilateral carpal tunnel syndrome and repetitive strain injury, with early-stage hand-arm vibration syndrome rated by assessors. The authors pointed to vibration from the grinder and from the handheld workpiece. A 1995 Czech study of 120 technicians found vibration above the limit value combined with upper-extremity overload, with finger paresthesiae reported by 47.4 percent and carpal tunnel syndrome accepted as occupational disease in 4 individuals.
Both sources are small or dated, and the case report describes one person, so read them as warnings, not rates. No national injury or incident rate for dental labs was found. Still, both point the same way: repetitive handpiece work carries a health cost that the wage math does not show.
The third risk is trusting vendor performance figures. The vendor case study reports a production cycle falling from 28 hours to 17 hours, and says impression to finished crown now takes four days or less. Those are self-reported numbers for one lab's whole production, so use them to ask questions, not to set your range.
What is a realistic timeline from assessment to payback?
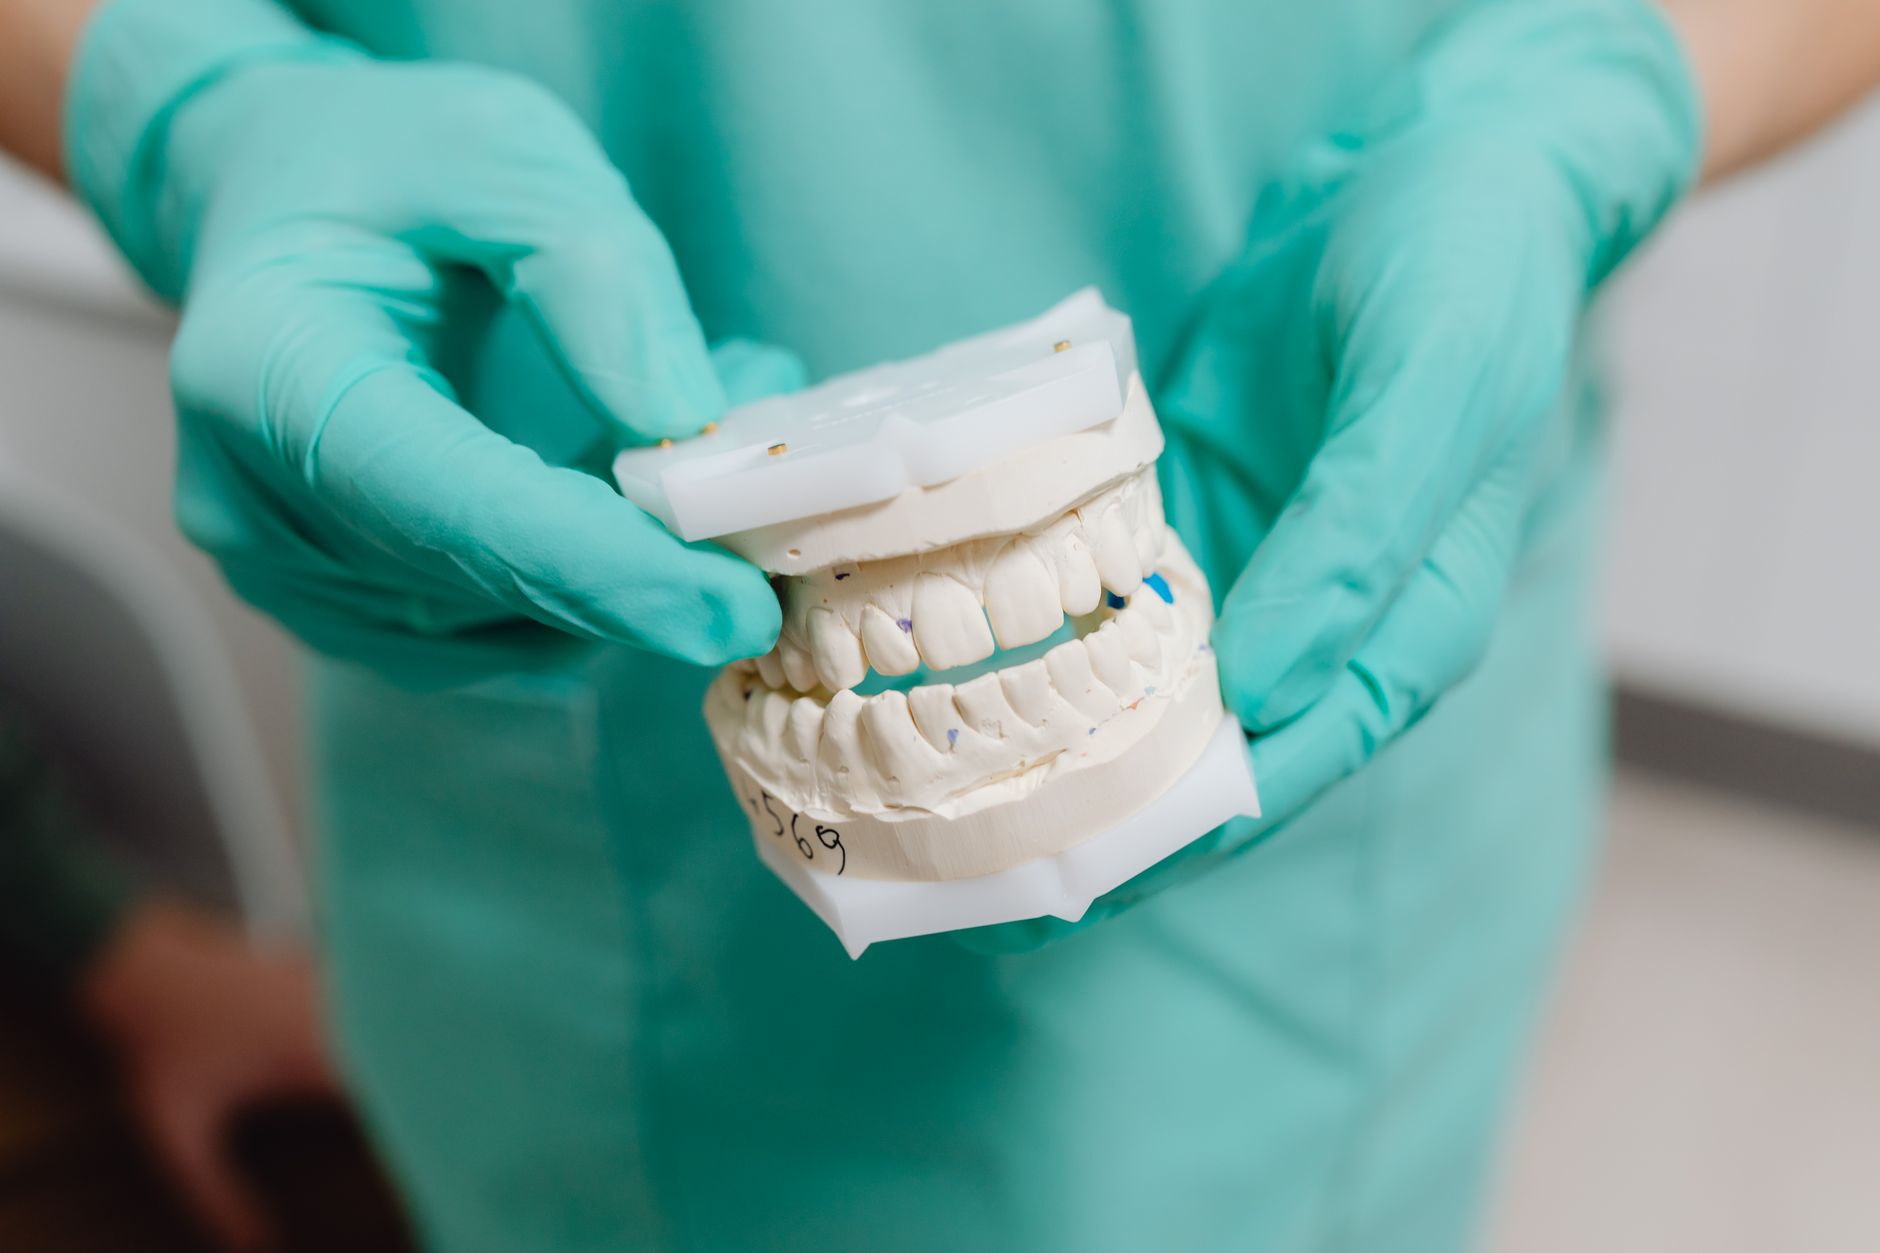
The path runs in stages: a site assessment that times your finishing hours and maps the stations, a written lease quote, a pilot cell on one station, integration and staff training, and then a review of the hours the cell actually takes over. Most of the uncertainty goes away in the first stage, so it pays to get the timing right there.
Integration deserves more attention than it usually gets. Connecting a cell to milling machine controls, lab software and your batch routine can take longer than the arm itself. Budget time for that in the pilot, and agree on who signs off on fit checks before the first live batch.
The pilot is the step labs most often underweight. Running one cell on a defined part family for long enough to see a full cycle shows how often parts fall outside the program, how long changeovers take, and whether quality checks fit the schedule. A second station can then be planned from measured data rather than estimates.
Payback is a range too. It depends on how quickly the pilot reaches its expected share of repeatable work and how many exceptions it throws. Compare the calculator range with the pilot's own data, not the quote alone.
How do I get a precise figure from a free site assessment?
A free site assessment replaces estimates with your numbers. We time a normal week of finishing across your stations, sort the part families, record changeovers and exceptions, and check where a fixed cell fits your floor, power and dust control. The result feeds the calculator with your hours rather than an industry average.
Once the assessment is done, the lease is quoted as a fixed robot lease payment through financing, with the terms in writing before you commit. We are a vendor-neutral robot integrator, so we choose the arm that fits the work rather than starting from one model. We deploy and integrate the cell, train your staff and service it nationwide, with on-site dispatch when a fault needs hands and remote triage for everything else.
To make the visit fast, bring three things: the restorations you finish most often, your shift schedule, and any health and safety reports on bench work. Those let the assessment start with real hours, so the range can narrow sooner.
Frequently asked questions
Want a cobot at your dental lab?
Tell us about your site. We will recommend the robot, quote the lease, and keep it serviced.
Sources
- US Bureau of Labor Statistics, Occupational Employment and Wage Statistics (OEWS May 2024)
- US dental laboratories business count report, 2026
- Bureau of Labor Statistics OEWS page for dental laboratory technicians
- Secondary summary of Bureau of Labor Statistics data for dental laboratory technicians
- Vendor case study on cobot tending of crown milling at a large US dental lab
- Trade association case study on cycle times at a large US dental lab
- 2024 case report on hand-arm vibration in a dental technician
- 1995 Czech study of vibration exposure in dental technicians
- 2024 conference paper on dental technician laboratories