
The short answer
Autonomous forklift ROI for grocery distribution centers comes mainly from taking over repetitive pallet moves between receiving, reserve storage and dock doors during night shifts that go unfilled. The savings range depends on how many of those hours the machine can realistically take, the lease cost, and how well the site's routes and staffing fit the equipment. A site assessment measures those inputs on your floor and turns the range into a lease quote for your building.
Key takeaways
- The return comes from night pallet moves that stall when shifts go unfilled, not from replacing a whole crew.
- Savings are a range set by the share of hours the machine takes over, the lease cost and the route layout.
- Turnover and unfilled shifts move the number more than headcount does.
- Forklift safety rules still apply, so route design and training shape much of the result.
- A site assessment is the way to get a precise lease quote for your own building.
Run the numbers for your site
Pick your city or state for a real regional number - we use the real BLS wage there. (On the live site this auto-detects from your location.)
What do you want to automate?
The robot takes the repetitive cart and pallet moves off the heaviest motion.
Where does autonomous forklift ROI for grocery distribution centers come from?
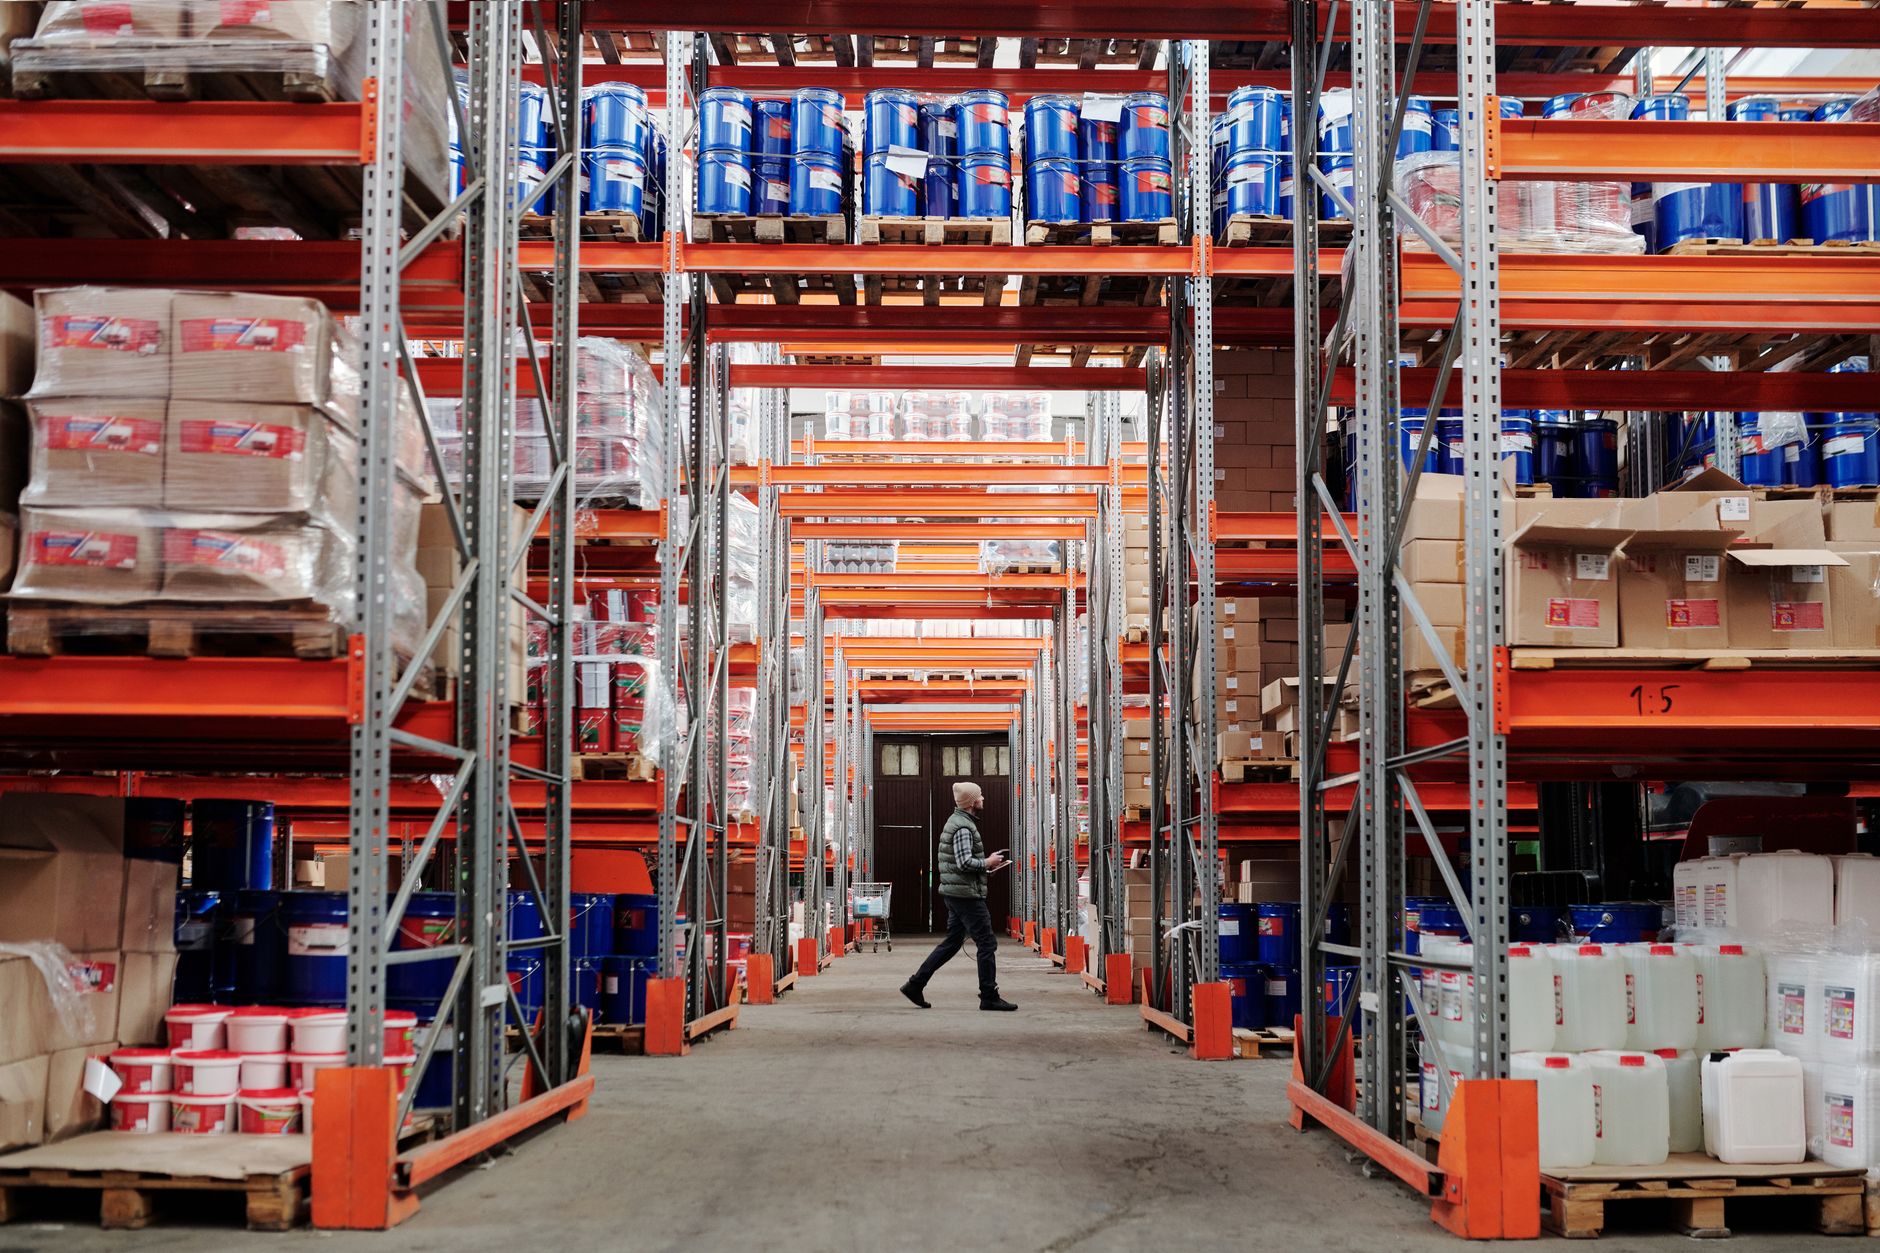
In a grocery distribution center, freight moves in a steady loop. Trucks arrive at receiving, pallets go into reserve storage, and orders are staged at outbound dock doors for the next store run. A large share of that load is repetitive pallet movement along fixed paths. When a night shift goes unfilled, those moves stall, trailers wait at the dock, and morning store deliveries start late. That stall is the cost the return is measured against.
The return comes from three places. The first is labor hours offset: the hours of pallet movement the machine takes over, valued at the local wage for laborers and freight, stock, and material movers, hand work, which the government wage data on this page shows. The second is continuity, meaning moves that keep running on schedule when staffing is thin so dock doors keep turning. The third is the overtime and agency cover that those short shifts would otherwise require, which depends on how your site staffs nights today.
Scale helps set expectations. According to the Bureau of Labor Statistics Occupational Outlook Handbook, there were about 7.0 million hand laborers and material movers jobs in 2024, a large pool of work that many employers compete to fill. The handbook also gives 2,988,900 jobs for the detailed laborers and freight, stock, and material movers, hand group, from the 2024 projection-table estimate.
How big is the grocery distribution workload?
No current count of US grocery distribution centers was found in this research, and no published headcount for grocery distribution centers was located. Staffing numbers should come from your own roster during the assessment. The closest federal measure is the warehousing and storage group. The Bureau of Labor Statistics industry at a glance page for NAICS 493 reports 22,929 private-industry warehousing and storage establishments in Q4 2024, rising to 23,539 in Q3 2025 on a preliminary basis. Grocery sites are a slice of that group, so use the national count as context rather than as a grocery total.
Forklift work is a large part of this sector. The Bureau of Labor Statistics series shown on FRED lists 322,590 industrial truck and tractor operators in 2024. Dividing that figure by the 22,929 warehousing and storage establishments gives a rough national average of about 14 operators per site, across all warehousing rather than grocery alone. That is the labor pool many sites draw on for night operations, and it is also the pool that is hardest to fill on short notice. A machine that covers the repetitive share of that work reduces how much your night plan depends on any single hire.
Median hourly wage, Laborers and Freight, Stock, and Material Movers, Hand
$4,380
Monthly cost of one full-time worker, at the median wage plus payroll costs (an estimate, not a quote).
How does the ROI math work for a grocery distribution center?
The model is simple at its core. Start with the hours per shift that repetitive pallet moves consume and that the machine can realistically take over. Multiply those hours by the local wage for that kind of work, using the government wage data on this page. Add the overtime, agency and unfilled-shift cover that the machine removes. Then subtract the lease cost, including any service and integration terms in the quote. The result is a savings range, and it is a range because each input moves.
Two inputs carry most of the weight. The first is the share of work the machine takes. It can run fixed paths between receiving, storage and dock doors, but it does not do every task. Damaged pallets, hand-stacked loads and exceptions stay with people. A realistic share comes from mapping the real flow on your floor, not from a machine's rated speed. The second input is how often shifts go unfilled. A site with steady full staffing gets a smaller offset than one that loses night hours most weeks.
Lease cost is the other side of the equation. Robots are leased through financing. The lease quote follows a free site assessment because the payment depends on the machine chosen, the layout, the integration work and the service level. Compare quotes on the same assumptions so the savings range is measured against the same hours.
How many hours can a robot take over on a grocery shift?
Hours are the piece only your floor can settle. Published federal data does not give hours per pallet move for grocery distribution centers, so the table below describes the kinds of work involved and leaves the hour counts to be filled from timed observations on your shifts. Time several full cycles, including a receiving peak and a weekend store run, because one shift often misleads.
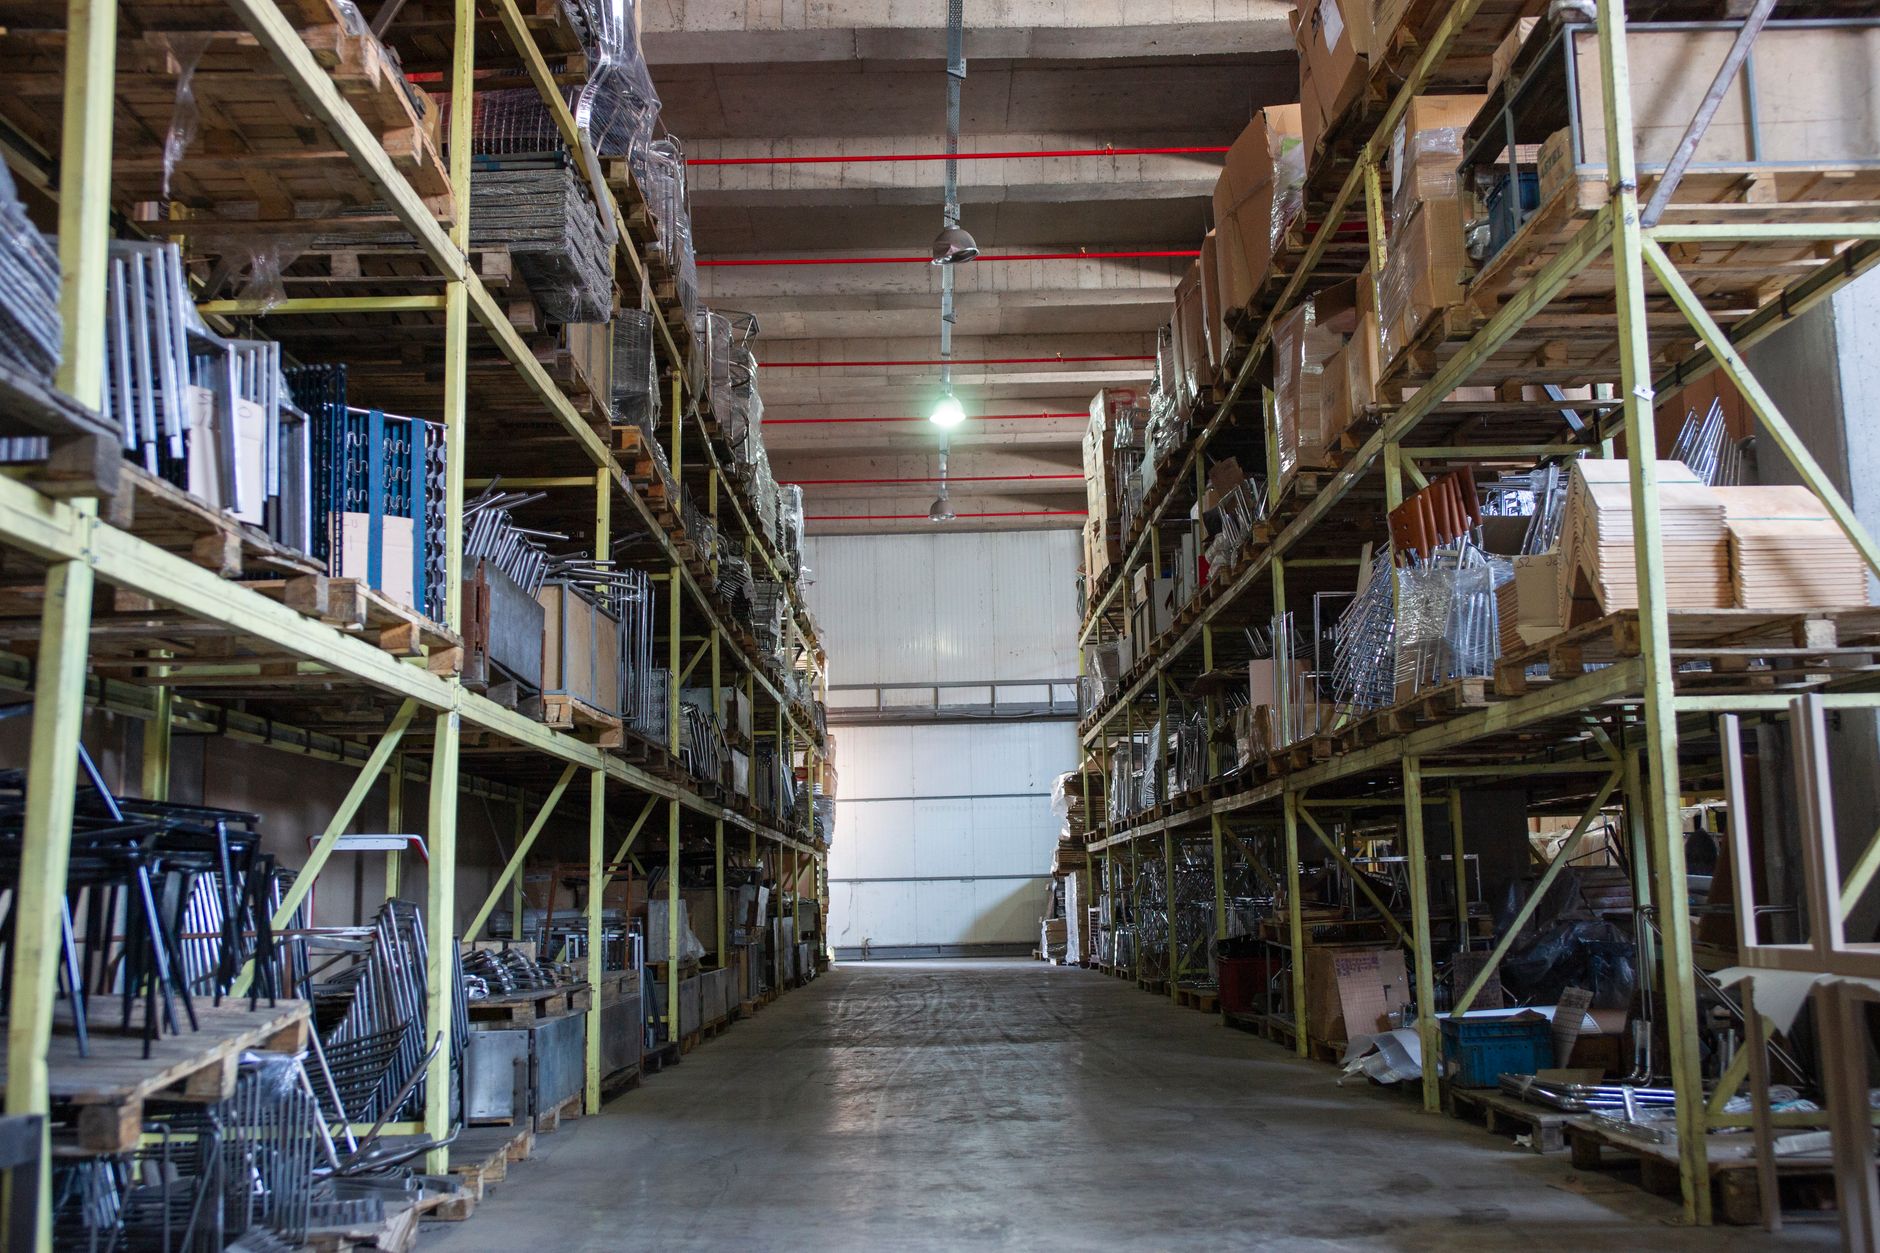
A practical method is to split the night into tasks. Moves from receiving to reserve storage, from reserve to pick-face staging, and from staging to outbound dock doors repeat and follow stable paths. Those are the hours a machine can realistically take. Breakdowns, cold-chain holds, dock conflicts and manual exceptions stay with staff, and so does supervision of the route plan.
| Task | Today | With a robot |
|---|---|---|
| Receiving to reserve storage moves | Hours logged in your walk-through | Machine takes the repetitive share, staff keep exceptions |
| Reserve storage to pick-face staging | Timed over several full cycles | Scheduled on fixed routes through the night |
| Staging to outbound dock doors | Timed at peak store-run hours | Dock doors keep turning when the shift is short |
| Damaged or irregular pallet handling | Measured separately as exception time | Stays with staff |
| Route supervision and exceptions | Covered by a lead or supervisor | A person monitors the fleet and clears exceptions |
These are not published federal or industry hour figures for this setting. The today column is filled from timed counts on your site during the free assessment.
What changes the savings range up or down?
Several factors move the range in predictable directions. Longer, straighter routes and dense pallet traffic raise the share of work the machine can take. Dock congestion, frequent layout changes and mixed-temperature zones lower it. Unfilled night shifts raise the value of the offset, while steady full staffing with low turnover shrinks it. The checklist below lists the checks to make before you trust the range.
Safety performance feeds back into the number too. Forklift incidents bring downtime, claims and rework. A site with a weak record may gain more from route separation and training than from a simple labor swap, so the assessment should look at incident history alongside the hours.
How does staffing turnover affect the return?
Turnover is one of the largest hidden drivers. According to the Instawork 2025 State of Warehouse Labor report, most respondents reported turnover below 10 percent, with a notable share at 20 percent or higher, though the bands in the excerpt were not legible. An Ahearn Supply Chain article, citing recent industry surveys, reports average warehouse turnover of 11.6 percent. These measures use different survey methods, so read them as a range rather than a single benchmark.
Fountain's warehouse turnover analysis estimates about 2.2 percent monthly voluntary turnover for transportation, warehousing and utilities in 2025, which it puts at about 26.4 percent annualized. The annualized figure is a derived estimate, so treat it with care. For the return, the useful number is how many night hours go uncovered over a year, and what that gap costs in overtime, agency cover and delayed trailers.
A machine does not remove turnover, and it does not replace the supervisor who trains new hires. It reduces how often a night shift runs short, which limits the damage a turnover spike causes to the outbound schedule.
- Night coverage
Autonomous Forklift
Runs fixed routes through the shift without a break
Staff
Can cover at short notice and adapt when plans change
- Exception handling
Autonomous Forklift
Pauses for obstacles and needs staff for unusual loads
Staff
Judges damaged pallets, mixed loads and unusual pickups
- Consistency on repeat moves
Autonomous Forklift
Same path and speed on every cycle
Staff
Varies with fatigue, experience and pace
- Training and onboarding
Autonomous Forklift
Route set once, with staff trained to supervise and clear exceptions
Staff
Each new hire needs training on routes, equipment and safety
- Turnover exposure
Autonomous Forklift
Not affected by turnover
Staff
Exposed to turnover, absence and agency cost
- Flexibility
Autonomous Forklift
Works best on stable layouts
Staff
Adapts quickly to layout and volume changes
What are the risks to the return, and how do you avoid them?
The first risk is safety. According to the Bureau of Labor Statistics industry page for NAICS 493, warehousing and storage reported a total recordable case rate of 4.8 per 100 full-time workers, and 4.1 for days-away, restriction or transfer cases. The reference year is not stated on the excerpt. The California Department of Industrial Relations reports a 2024 total recordable rate of 6.3 for warehousing and storage in that state. A single forklift incident can wipe out the savings from several shifts.
Older OSHA estimates, as reported in trade coverage, put forklift injuries at about 35,000 serious and 62,000 non-serious cases per year. Those figures are dated and mixed in scope, so use them for direction only. The governing rule for general industry is the OSHA powered industrial truck standard at 29 CFR 1910.178. A machine in the aisles does not change the employer's duties under that standard.
The other risks are layout and dependency. A route that crosses a busy dock, a blocked lane or a changed rack plan breaks the schedule. Avoid these by mapping the building before go-live, keeping lanes clear, holding a stable dock door plan, and keeping a supervisor who can clear exceptions. Plan for downtime as well. A unit can stop, so staff need a manual fallback for short periods.
What is a realistic timeline from assessment to payback?
Expect the timeline to run in stages. The first is the free site assessment, where the building is walked, the flow is timed and the lease quote is prepared. The second is mapping and integration, where routes are set on the actual floor and dock rules are agreed. The third is a limited pilot on one zone or one shift, with staff trained to supervise and clear exceptions. The fourth is go-live support and then a wider rollout once the pilot holds.
Payback follows the offset, so it depends on how quickly the measured hours are actually taken over. A pilot shows the real share of work and the real exception rate, and those are the numbers the payback is built from. Timelines vary with site size, layout changes and internal approvals, so ask for the schedule in the quote rather than assuming one.
How do you get a precise figure from a free site assessment?
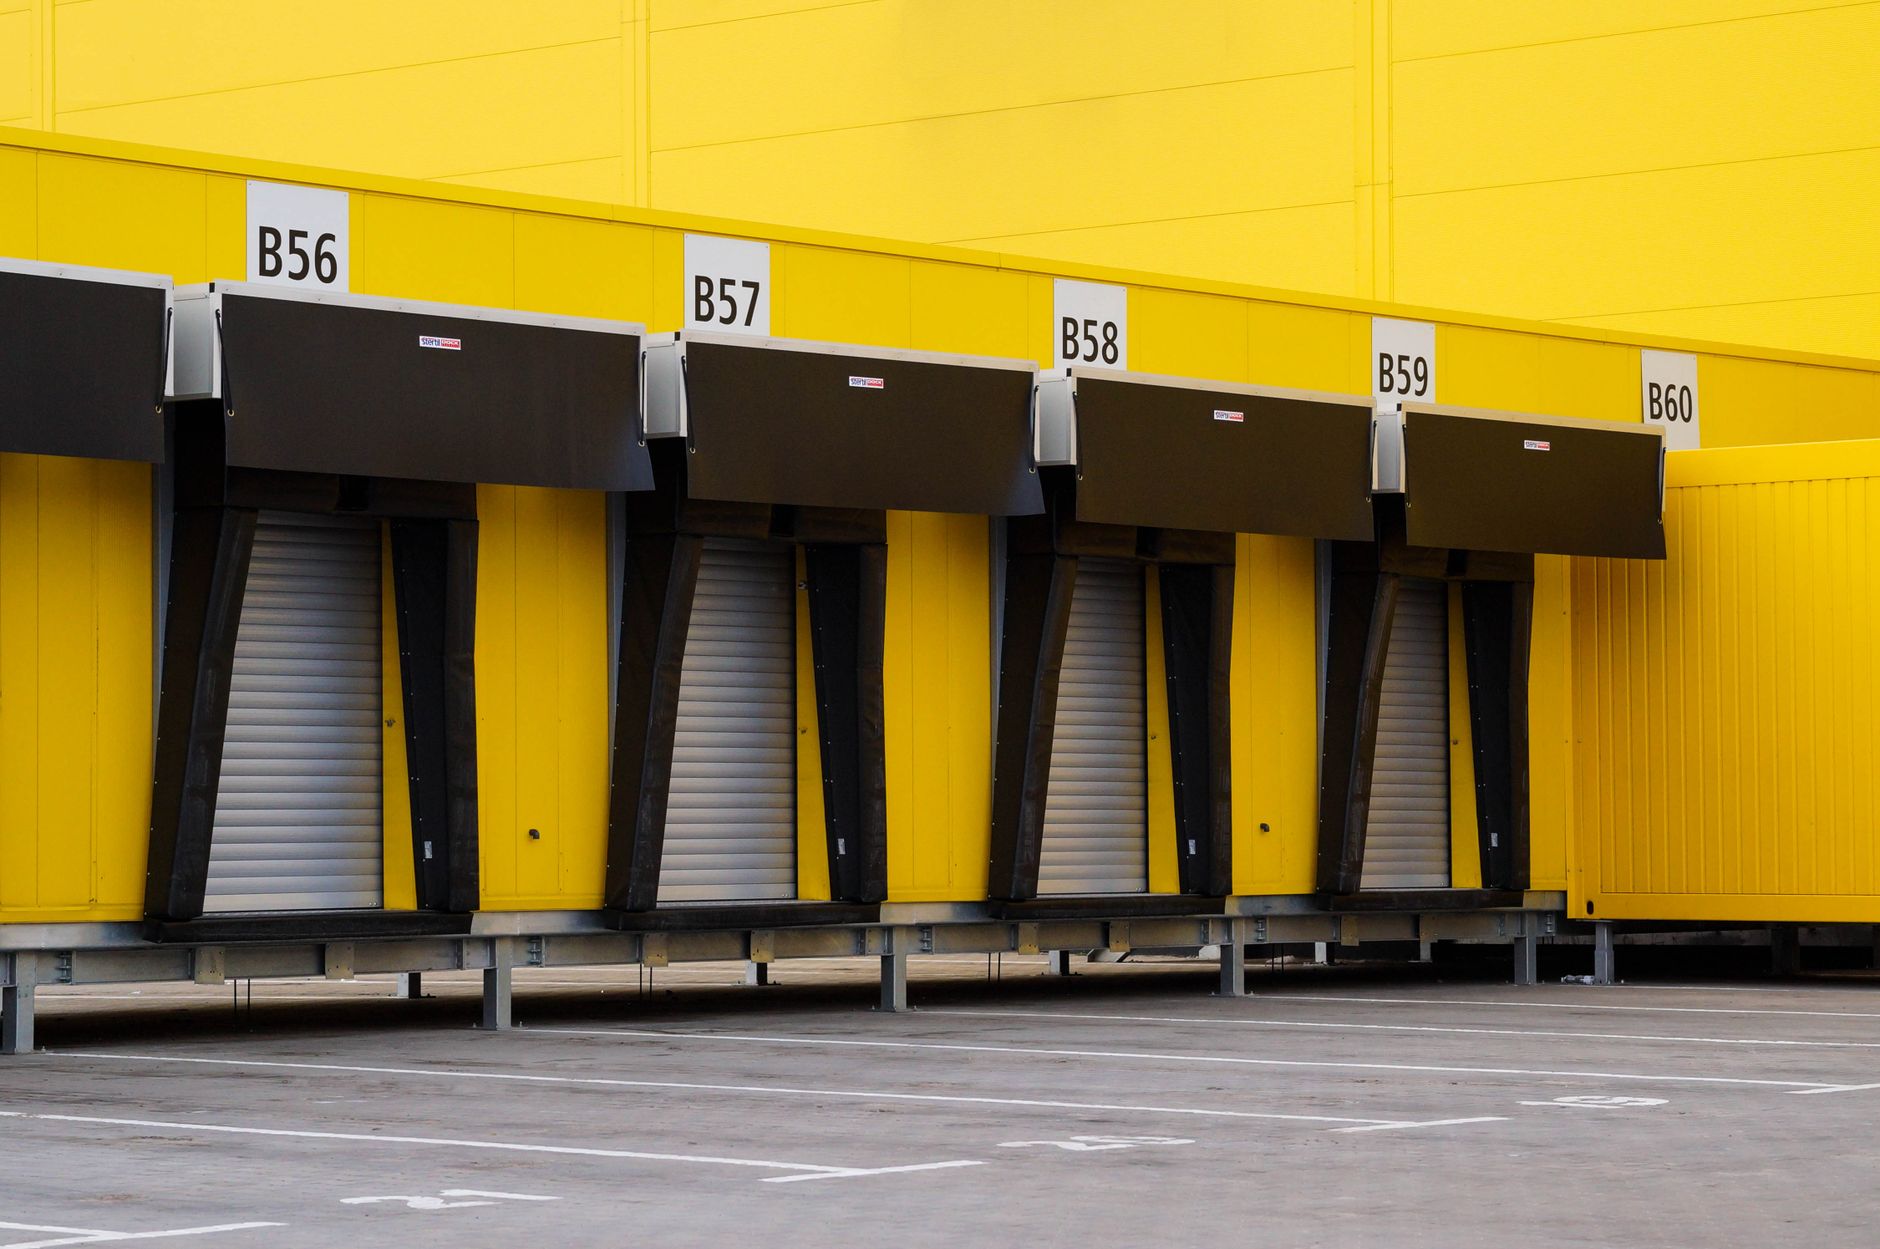
A precise figure comes from measured inputs. During a free site assessment, the team walks the building, maps the routes, times the moves on your shifts, counts unfilled night shifts over the last quarter, and checks the dock and cold-room zones. Those counts set the share of work the machine can take and the offset it can deliver against the lease cost.
We are a US commercial robot integrator. We pick the right machine for the site, lease it through financing, deploy and integrate it, train the staff and service it nationwide. The lease payment comes in a quote after the assessment, with service, integration and response terms written out, so the range on this page becomes a number for your building.
Before you decide, ask for the assumptions behind the quote: the hours taken over, the exception share, the service response terms and how the lease ends. A quote should show its inputs, and it should say where the result could fall short.
Frequently asked questions
Want an autonomous forklift at your grocery distribution center?
Tell us about your site. We will recommend the robot, quote the lease, and keep it serviced.
Sources
- US Bureau of Labor Statistics, Occupational Employment and Wage Statistics (OEWS May 2024)
- BLS Occupational Outlook Handbook: Hand Laborers and Material Movers
- BLS Industry at a Glance: Warehousing and Storage (NAICS 493)
- BLS industrial truck and tractor operators series via FRED
- Instawork 2025 State of Warehouse Labor Report
- Ahearn, Supply Chain warehouse turnover article
- Fountain, warehouse turnover rate analysis
- California Department of Industrial Relations, 2024 Injury and Illness Table 1
- Forklift Action news on OSHA forklift injury estimates