
The short answer
The autonomous forklift ROI for appliance distributors comes from two places: fewer crew hours spent on heavy pallet moves between docks and racks, and more inbound and outbound trucks handled in the same footprint. The savings range is the labor hours the robot realistically takes over, set against a fixed lease payment that is quoted after a free site assessment. Treat the result as a range to test on your floor, not a promise.
Key takeaways
- Dock throughput and recovered floor space drive most of the return, not labor hours alone.
- The share of pallet moves the robot takes over is the biggest variable, so measure it first.
- Compare the lease quote from a site assessment against the hours offset, not a generic estimate.
- Pilot one fixed route before committing a full fleet to the building.
- Clear aisles, repeatable routes and stable crews decide whether the range holds.
Run the numbers for your site
Pick your city or state for a real regional number - we use the real BLS wage there. (On the live site this auto-detects from your location.)
What do you want to automate?
The robot takes the repetitive cart and pallet moves off the heaviest motion.
How does an autonomous forklift pay off for an appliance distributor?
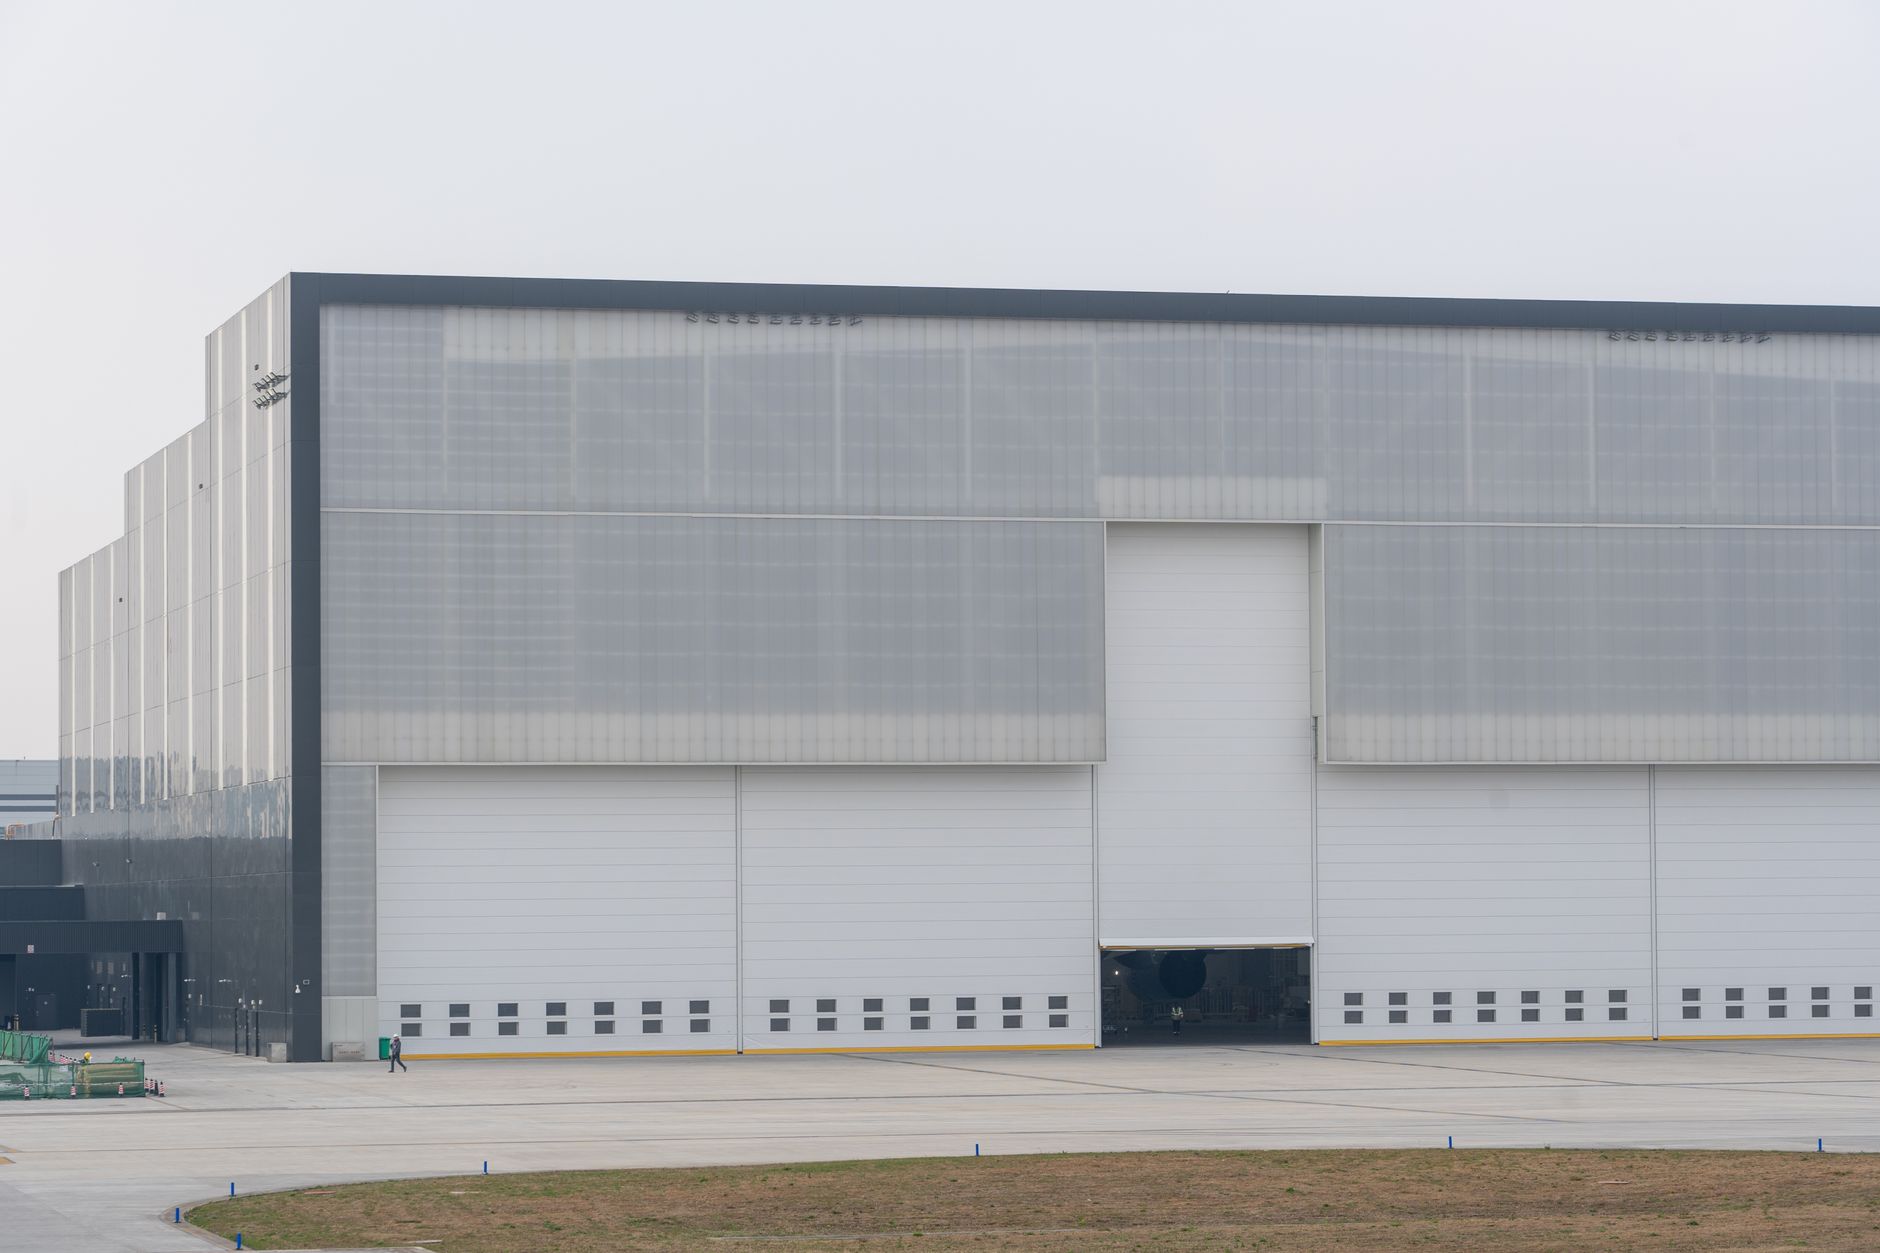
The autonomous forklift ROI for appliance distributors depends on what the building does with its docks and floor. An appliance distribution center moves large, heavy pallets between inbound trailers, staging and racks, often across several shifts in the same aisles. When those moves slow down, trailers wait at doors and staging spills into the aisles, so the building looks full even when it has room on paper.
We are a US commercial robot integrator. We pick the robot that fits the site, lease it through financing, deploy and integrate it, train the staff and service it nationwide. Our view of the return is practical: which hours move, which doors open up, and what the fixed lease payment costs against those gains. The rest of this page works through that math in the order a decision maker would check it.
Where does the return come from in this setting?
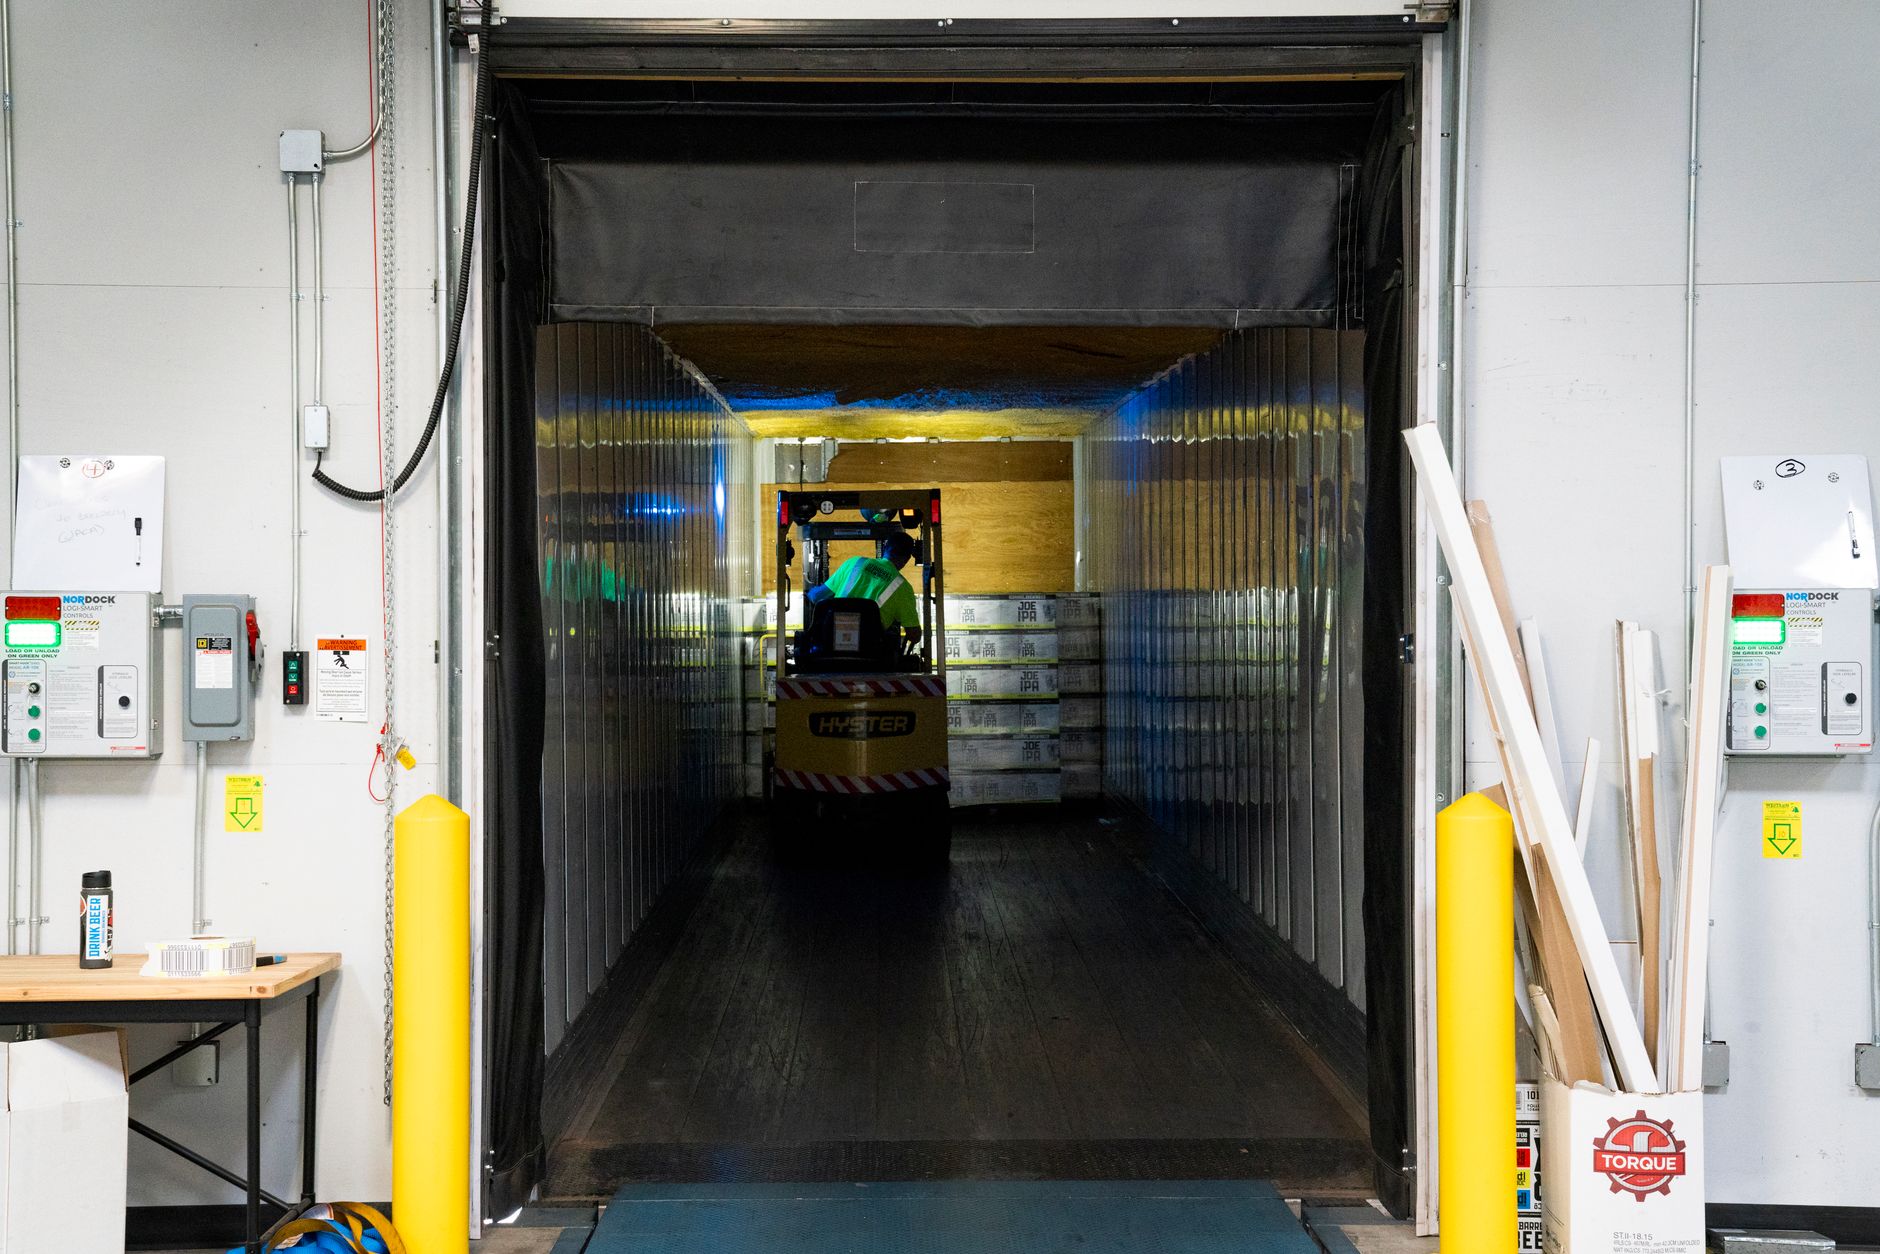
Most of the return in an appliance warehouse comes from throughput. Autonomous forklifts run fixed paths between the receiving dock, staging and the racks. Because the path repeats, a trailer unloads, its pallets move and the next trailer gets a door sooner. The building handles more trucks in the same footprint, and that matters most in peak weeks, when doors rather than people are the constraint.
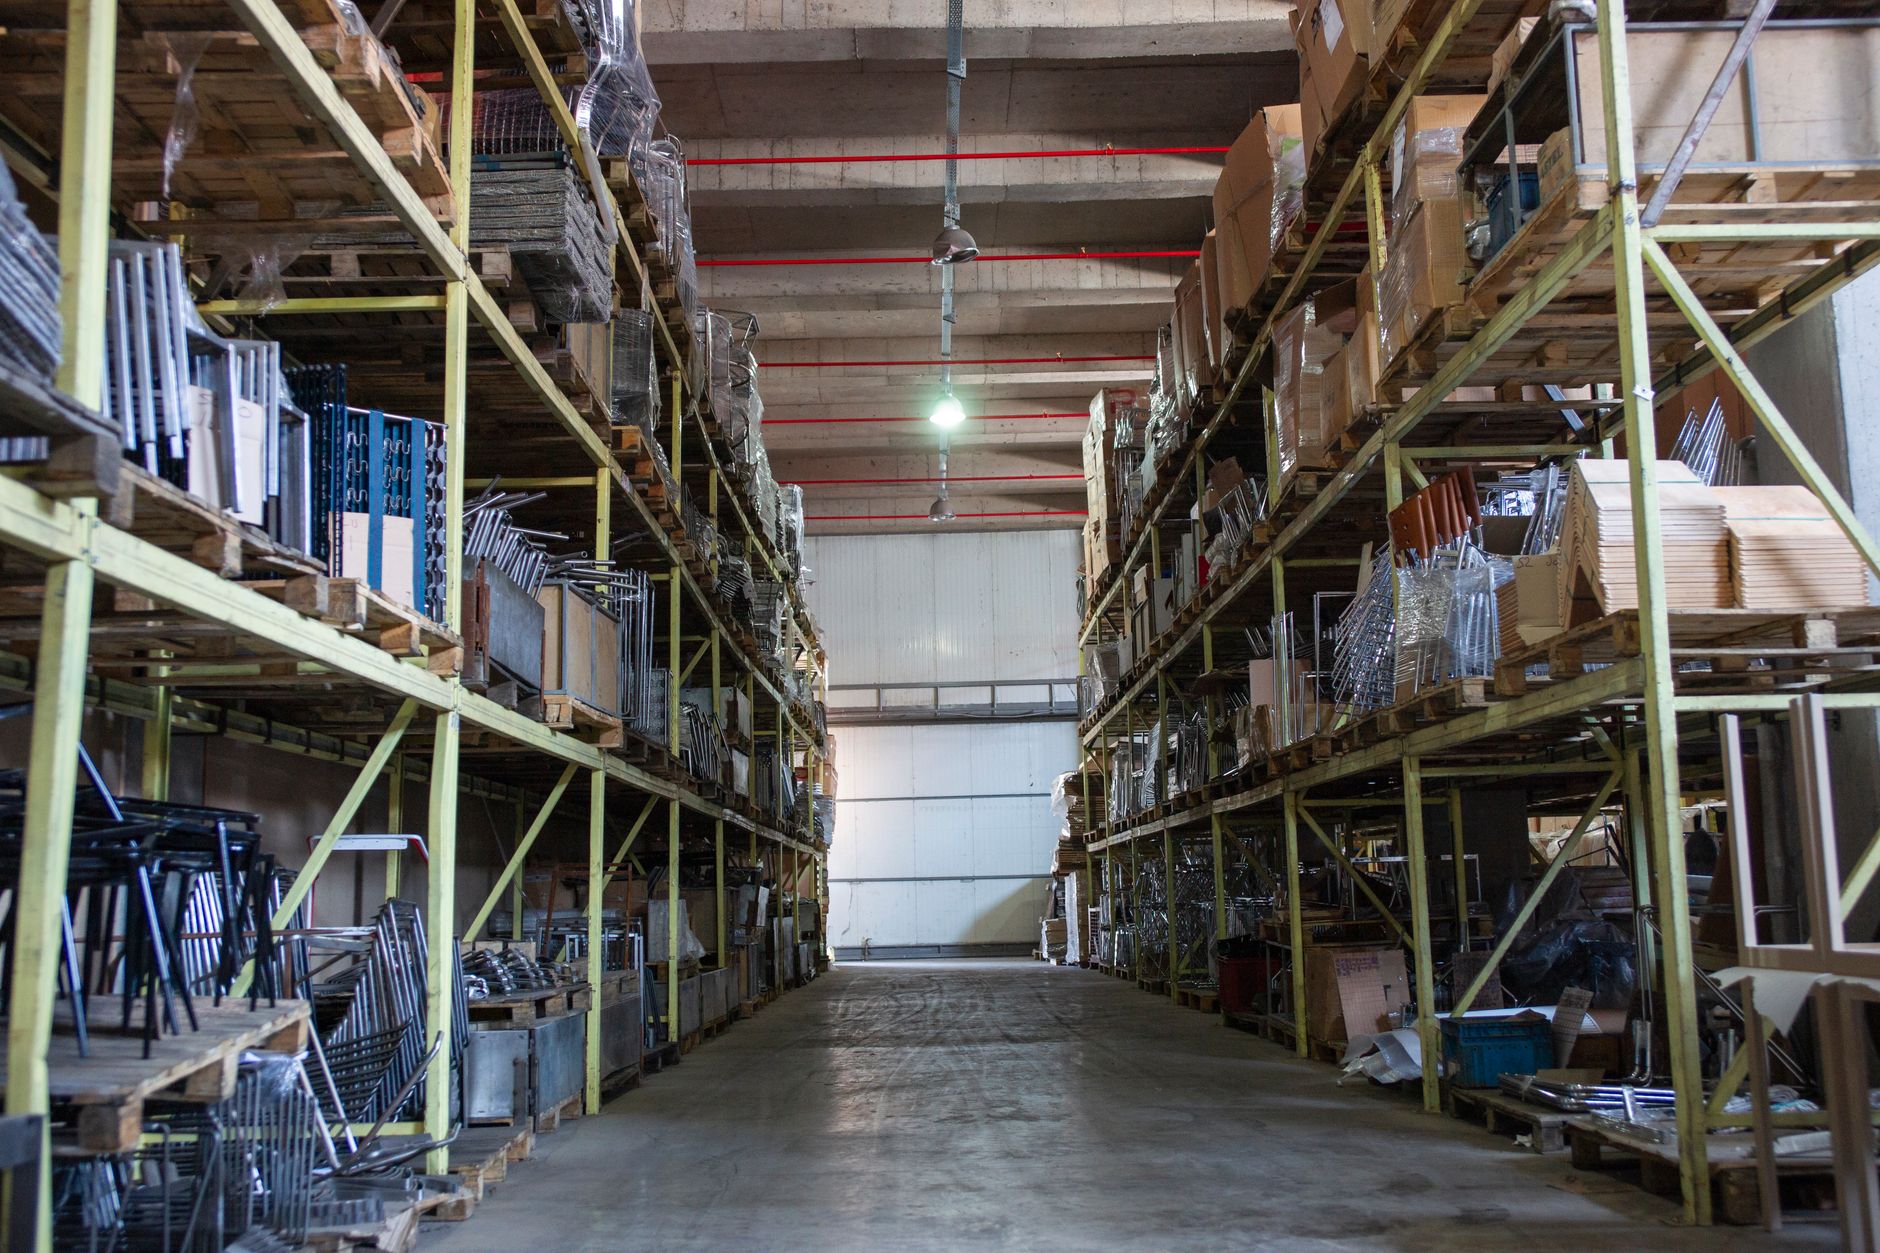
Floor space is the second source. Pallets waiting in crowded aisles for a free forklift take up room that could hold stock or a second staging lane. Clearing those aisles lets the site store or stage more without expanding the building. A site at door capacity often gains more from throughput than from a small labor offset, so the assessment should count doors and aisle width before it counts crew hours.
Median hourly wage, Laborers and Freight, Stock, and Material Movers, Hand
$4,380
Monthly cost of one full-time worker, at the median wage plus payroll costs (an estimate, not a quote).
How do you calculate the savings range?
The math has three inputs. First, the hours of laborers and freight, stock, and material movers, hand type of work on the site that the robot could take over, measured from a time study of pallet moves per shift. Second, the share of that work the robot realistically takes, which is never all of it, because irregular loads, damaged pallets and exceptions still need a person. Third, the lease cost, quoted after the site assessment and driven by fleet size, route plan and service terms.
The hours offset is the hours the robot takes multiplied by the share it can handle, valued at the government wage data on this page for this job, then compared with the lease cost over the same period. The calculator on this page is pre-filled for appliance distribution and shows a savings range rather than one figure. The range moves as the inputs move, which is why we do not quote a single number before the site is mapped. Hours are a labor figure, and they become cash only when overtime falls or the crew is redeployed, so decide that before the numbers go to finance.
| Task | Today | With a robot |
|---|---|---|
| Pallet moves from inbound trailer to staging | Hours per shift from the site time study | Share the robot takes, set in the assessment |
| Pallet moves from staging to racks | Hours per shift from the same study | Share on fixed routes, measured in the pilot |
| Exception and damaged-load handling | Hours per shift logged by the crew | Stays with a person, so no offset |
| Extra moves in peak weeks | Overtime or temporary hours in peak weeks | Covered only if units and route capacity exist |
Hour figures come from the site's own time study during the assessment, not from published data. The offset counts only the share of each task the robot is measured to take.
What do the labor numbers say about this kind of site?
The Bureau of Labor Statistics Occupational Outlook Handbook lists 2,988,900 jobs for laborers and freight, stock, and material movers, hand, and describes about 7.0 million jobs across hand laborers and material movers in 2024. That is the work a forklift takes off the floor. Those jobs are spread across warehousing, manufacturing, retail and wholesale, so the count for any one distributor is far smaller than the national total. Use the handbook for scale, and use the site time study for the hours that matter to your building.
Turnover is the other labor fact that shapes the return. A staffing platform's 2025 warehouse labor report says most respondents reported turnover under 10 percent. Stable crews are easier to train on robot handoffs and rules. For market size, a business reference guide reports 3,048 businesses in NAICS 423620, household appliances, electric housewares and consumer electronics, with the data year not stated. An unofficial third-party count for Utah lists 258 establishments and 4,432 employees in appliance and electronics wholesale, about 17 people per establishment on average across all roles, and only part of that staff moves pallets.
How fast is automation spreading across North American industry?
A3, the association that tracks robot orders in North America, reported that full-year 2025 orders rose 6.6 percent, according to a robotics trade news write-up of its release. Fourth quarter 2025 orders were 10,325 robots, up from 8,277 in the fourth quarter of 2024, and cobot orders for the year reached 7,212. Orders measure demand, not installations, so read them as a sign the category is maturing rather than as proof of any one site's return.
In its third quarter 2025 report, A3 recorded orders up 11.6 percent, with non-automotive sectors at 59 percent of demand, as reported by trade news coverage of that release. A vendor-run survey reported by a trade news site found more than 70 percent of respondents planned to extend automated fleets within two years, most by three or more vehicles. That survey is vendor-reported, so treat it as a directional signal. Growing demand outside auto plants is the trend that matters for a distributor.
What do injury rates mean for an autonomous forklift decision?
Warehousing is a high-incident industry. Figures reported from BLS-based data put warehousing's total recordable rate at 4.8 cases per 100 full-time workers in 2024, against 2.6 for all industries. We have not yet checked that figure line by line against the BLS industry page, so confirm it there before it goes into a board deck. The rate is a reason to examine the forklift route itself, not a claim about any one site.
Pallet moves through crowded aisles are where powered truck exposure is often concentrated. Fixed autonomous routes take the driver out of the repetitive part of the move and keep trucks out of foot traffic when the layout is designed for it. That safety benefit is real when routes are separated from pedestrian flow, and weaker when people still cross the lane. Build the safety case in the assessment from your own incident log, not from industry averages.
What changes the number up or down?
The biggest swing factor is the share of moves the robot takes over. A site where most pallets follow a repeatable dock to rack pattern gives a higher share than a site with many one-off loads, special handling or mixed staging. Route length matters too, because a longer straight run returns more time per move than a short shuffle. Door count, trailers per shift and how often the layout changes complete the picture.
The number also moves with the fleet plan. One unit proves the route, and more units only add value if the work supports them. Peak weeks, racking changes and the number of trailers per shift all change the hours on the table. Staff training and clear rules for when a person takes over a move often decide whether the range holds or drifts.
What are the risks to the return, and how do you avoid them?
The main risk is over-modeling. A calculator that assumes every pallet move is automated overstates the return, and the first months show the gap. Avoid it by measuring the share of moves on fixed routes during the assessment, then building the range from that measured share, with a conservative case and an upside case. A second risk is a layout change after go-live that breaks the path. Agree on a change step so remapping happens before the path moves.
Uptime is the third risk. A stopped unit can stall a door, so the plan should include a spare unit or loaner arrangement, on-site dispatch and remote triage, and a written rule for what the crew does while a unit is down. Where a person still does the move, they need training for it. The table below sets out honestly where the robot and a person each win.
- Repeatable dock to rack moves
Autonomous Forklift
Holds the same path and pace on every move, including late in a shift
Staff
Adjusts quickly when a route or load is unusual
- Irregular or damaged pallets
Autonomous Forklift
Needs a person to clear the exception and reset the move
Staff
Inspects, reroutes and decides on the spot
- Off-peak and extended shifts
Autonomous Forklift
Can run when a person supervises the site
Staff
Limited by shift rules, fatigue and overtime rules
- Peak week surge
Autonomous Forklift
Adds moves only where units and route capacity are already in place
Staff
Can be added or redeployed, but needs time to train
- Layout changes
Autonomous Forklift
Needs remapping before the path moves
Staff
Adapts to a new aisle without setup
- Crowded aisles
Autonomous Forklift
Fixed routes keep trucks out of foot traffic when people stay out of the lane
Staff
Reads a crowded aisle and stops early
What is a realistic timeline from assessment to payback?
The sequence runs in phases. A site assessment comes first, with a time study of pallet moves, door counts and aisle mapping. Next comes the lease quote and a pilot on one route, which tests the share of moves the robot takes in real traffic. After the pilot, the fleet plan follows, then deployment, integration, staff training and go-live support. Payback is measured after enough shifts show a steady share, so the range is refined over the first months rather than fixed at signing.
The timeline depends on the building, the number of routes and how quickly the layout can be mapped. We do not quote a payback date before the pilot shows the measured share. Expect the early weeks to show the largest gap between modeled and actual share, and expect the range to narrow as routes settle. Plan for that gap rather than treating early numbers as final.
How do you get a precise figure from a free site assessment?
Request the free site assessment with the dock supervisor and operations lead present. We map the building, record pallet moves per trailer and per shift, count doors and staging points, and check aisle widths and any planned racking changes. The output is the hours offset, the measured share of moves on fixed routes and a lease quote for a fleet size that fits. Those results replace the pre-filled calculator inputs with your own numbers.
Bring data to tighten the figure: trailer counts for peak and normal weeks, overtime for the handling crew, turnover records and any incident log. We are a US commercial robot integrator, so the recommendation covers the right robot for the site, lease financing, deployment and integration, staff training and nationwide service. The lease quote comes after the assessment and is never presented as a promise of savings.
Frequently asked questions
Want an autonomous forklift at your appliance distributor?
Tell us about your site. We will recommend the robot, quote the lease, and keep it serviced.
Sources
- US Bureau of Labor Statistics, Occupational Employment and Wage Statistics (OEWS May 2024)
- A3 full-year 2025 North American robot orders report, trade news coverage
- A3 Q3 2025 robot orders report, trade news coverage
- BLS Occupational Outlook Handbook, hand laborers and material movers
- BLS industry profile, warehousing and storage (NAICS 493)
- Vendor-run automation fleet survey, trade news coverage
- Warehouse labor report 2025, staffing platform
- Unofficial third-party count, Utah appliance and electronics wholesale
- Business reference guide, household appliance wholesaling