
The short answer
An autonomous forklift at a steel service center returns value mainly by taking over repeat coil and pallet moves between receiving, storage and loading, which frees time that laborers and freight, stock, and material movers, hand would otherwise spend on predictable routes. Savings are presented as a range built from the hours the robot covers, the local wage for that job shown on this page, and the fixed lease payment, which is quoted after a free site assessment. The range narrows once the actual routes, shift hours and floor conditions are measured on site.
Key takeaways
- Savings come from hours of repeat coil and pallet moves, not from a fixed headcount cut.
- Savings are shown as a range valued at the government wage data for laborers and material movers.
- Forklift injuries remain a serious risk, so safety setup is part of the return.
- Quits are low nationally, so the case usually rests on filling open shifts rather than replacing leavers.
- The fixed lease payment is quoted after a free site assessment, once your routes are measured.
Run the numbers for your site
Pick your city or state for a real regional number - we use the real BLS wage there. (On the live site this auto-detects from your location.)
What do you want to automate?
The robot takes the repetitive cart and pallet moves off the heaviest motion.
Autonomous forklift ROI for steel service centers: what return to expect
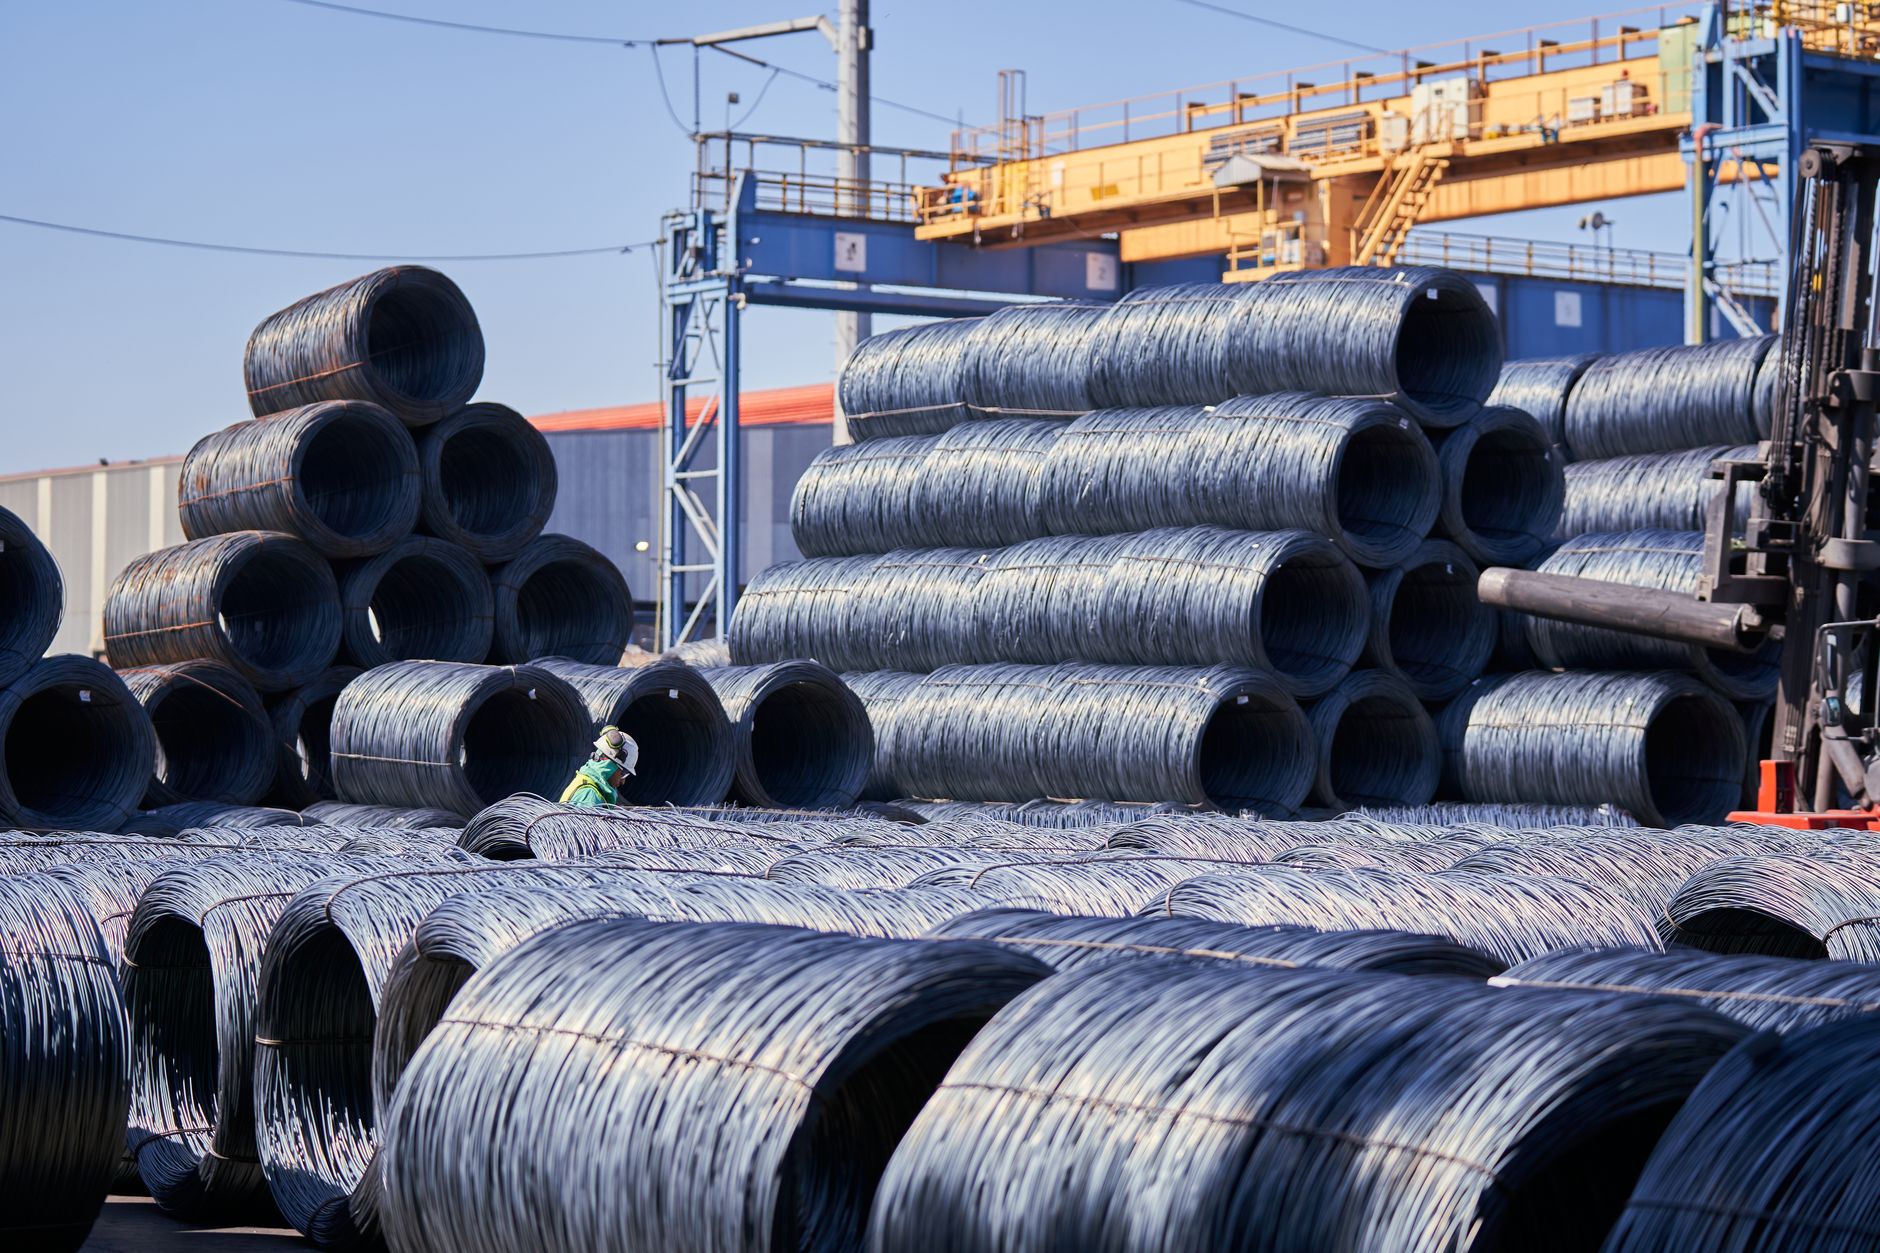
A steel service center moves material all day. Coils come off inbound trucks, go into storage, get pulled for processing and then get staged at the loading dock. Pallets of sheet, plate and bar follow similar paths. Most of these moves repeat on the same routes, which is the condition where an autonomous forklift earns its keep.
The return is not a headcount argument. It is a question of hours. Each leg the robot runs is a leg a person does not run on that shift, and those hours are valued at the wage for laborers and freight, stock, and material movers, hand, shown in the government wage data panel on this page. Where staffing is hard, the value also lies in keeping shifts covered when applicants are scarce.
We will not promise a payback date on this page. What we can give you is the method, the factors that move the number, and a way to measure your own floor before anyone commits to anything.
Where does the return come from in a steel service center?
Three areas usually carry the work. Receiving is where inbound coil and pallet loads are unloaded and checked. Storage is where material is placed in racks or coil positions and retrieved later. Loading is where finished or staged material moves to outbound trucks. Processing lines add internal moves between storage and cutting or slitting equipment.
Each of those legs follows a route that is largely fixed. Routes repeat through the shift, and the same origin and destination pairs show up again and again. The return shows up where the route is long, the pick is repeated and an operator would otherwise wait between loads.
Two things make the return hard to estimate from outside. The mix of coil weight and pallet size changes with each customer order, and the share of moves that happen on fixed routes varies at every plant. That is why the site assessment maps the actual flow before any number is set.
Median hourly wage, Laborers and Freight, Stock, and Material Movers, Hand
$4,380
Monthly cost of one full-time worker, at the median wage plus payroll costs (an estimate, not a quote).
How is the savings math worked out?
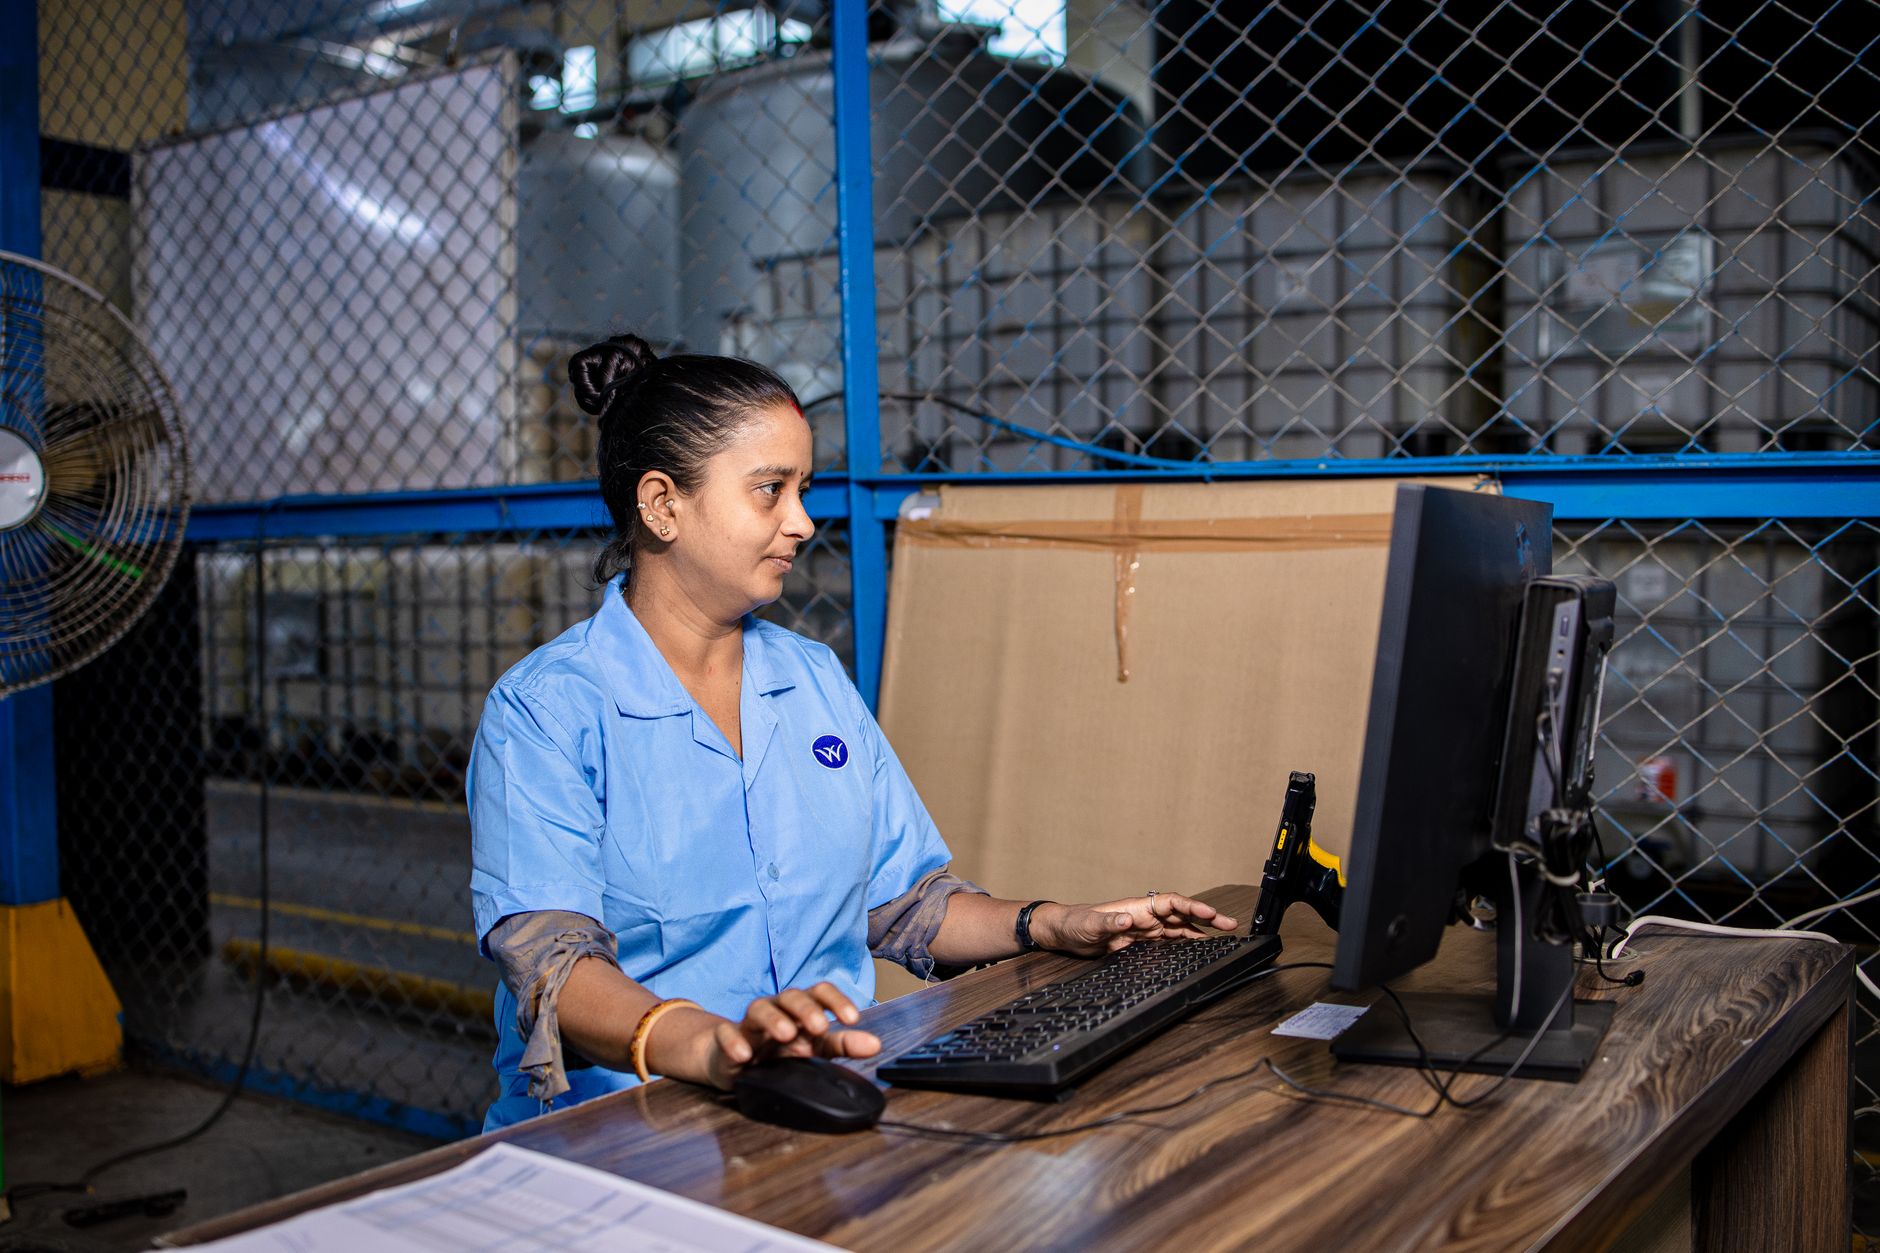
The math has three parts. The first is labor hours offset: the hours per shift that a worker in laborers and freight, stock, and material movers, hand work spends on the moves the robot takes over. The second is the share of that work the robot realistically takes, since not every move fits a fixed route. The third is cost: the fixed lease payment for the robot and its service, quoted after the site assessment.
Put simply, the savings range is the robot-covered hours valued at the local wage for that job, less the lease cost for the same period. The government wage data on this page shows the figure for that job, so you can test your own hours against it. A wide range is normal at this stage, because the share of work the robot takes is the least certain input until the routes are measured.
The range also reflects what happens on the floor. A robot does not take breaks and does not call out sick, but it still needs staff to handle exceptions, load changes and blocked aisles. Those hours come off the robot-covered hours, which is why the net range is narrower than the gross hours suggest.
What changes the number up or down?
The biggest driver is how much of the day's material moves on fixed, repeatable routes. A plant that stages from a few locations to a few docks will see more of its work covered than one with many one-off moves. Route regularity is the first thing we check.
The labor side matters too. Where the job is hard to fill, unfilled shifts raise the value of covered work, but the savings range still starts from the government wage data for the job, not from an assumed premium. Facility layout is the third factor. Aisle width, floor condition, dock height and the number of doors all decide how much of a route is practical for the robot without rework.
Two more factors move the range. The number of units matters, since one unit on one route behaves differently from a small group sharing dock traffic. The mix of loads also matters, because heavier coils and irregular pallets change the handling method and the share of moves the robot can take.
Can a robot really take over this work?
Partly, and the honest answer depends on the route. A robot handles repeat, planned moves well. A person handles the rest, including unusual loads, damaged packaging, last-minute changes and anything that needs judgment about where a load should go.
We frame the robot's role as taking the repeat legs off the people who would otherwise run them, so those people can focus on loading, checking and exceptions. The robot does not replace the whole job, and our estimates do not assume that it does.
Adoption data points the same way. According to A3, North American companies ordered 36,766 industrial robots in 2025, up 6.6 percent in units, and cobots made up 19.6 percent of those orders. A3's figures exclude mobile robots, so they show general automation demand rather than the moves discussed here.
- Repeat routes between fixed points
Autonomous Forklift
Runs the same legs every time without fatigue
Staff
Adjusts quickly when a route changes
- Shift coverage
Autonomous Forklift
Runs the scheduled route on each shift it is assigned
Staff
Covers absence, breaks and unplanned work
- Unusual or damaged loads
Autonomous Forklift
Needs load checks and may stop for them
Staff
Judges and handles them directly
- Exceptions and blocked aisles
Autonomous Forklift
Stops, signals and waits for staff
Staff
Clears the blockage and resumes the flow
- Consistency of pace
Autonomous Forklift
Holds the same pace through the shift
Staff
Varies with fatigue and workload
- Setup and route changes
Autonomous Forklift
Needs mapping and route programming
Staff
Learns a new route quickly with a walk-through
How big is the labor pool, and is staffing really the problem?
Staffing pressure is real but uneven. According to BLS JOLTS data for 2025, job openings averaged 7.1 million nationally, down 571,000 from 2024. Annual quits fell by 1.3 million in 2025, and the national quits rate averaged 2.0 percent. Low quits mean most people are staying in their jobs, which points toward filling open shifts rather than replacing people who leave. The local picture still needs checking.
The size of the setting gives a useful sanity check. An industry profile for NAICS 423510 reports 8,608 establishments and 145,207 employees for the broader group NAICS 42351, citing Census County Business Patterns 2023, while noting that Census does not publish 423510 separately. An older estimate counted about 9,900 metal wholesale locations in 2011, covering all metals rather than steel alone. A separate NAICS 423510 profile puts employment at about 14 to 15 employees per establishment, with the year unclear.
We have not verified a count of material movers per steel service center. The typical headcount listed for this page, 14, is the total staff proxy from that profile, not a count of the people doing this work. Your site's number will come from the assessment.
What are the risks to the return and how do you avoid them?
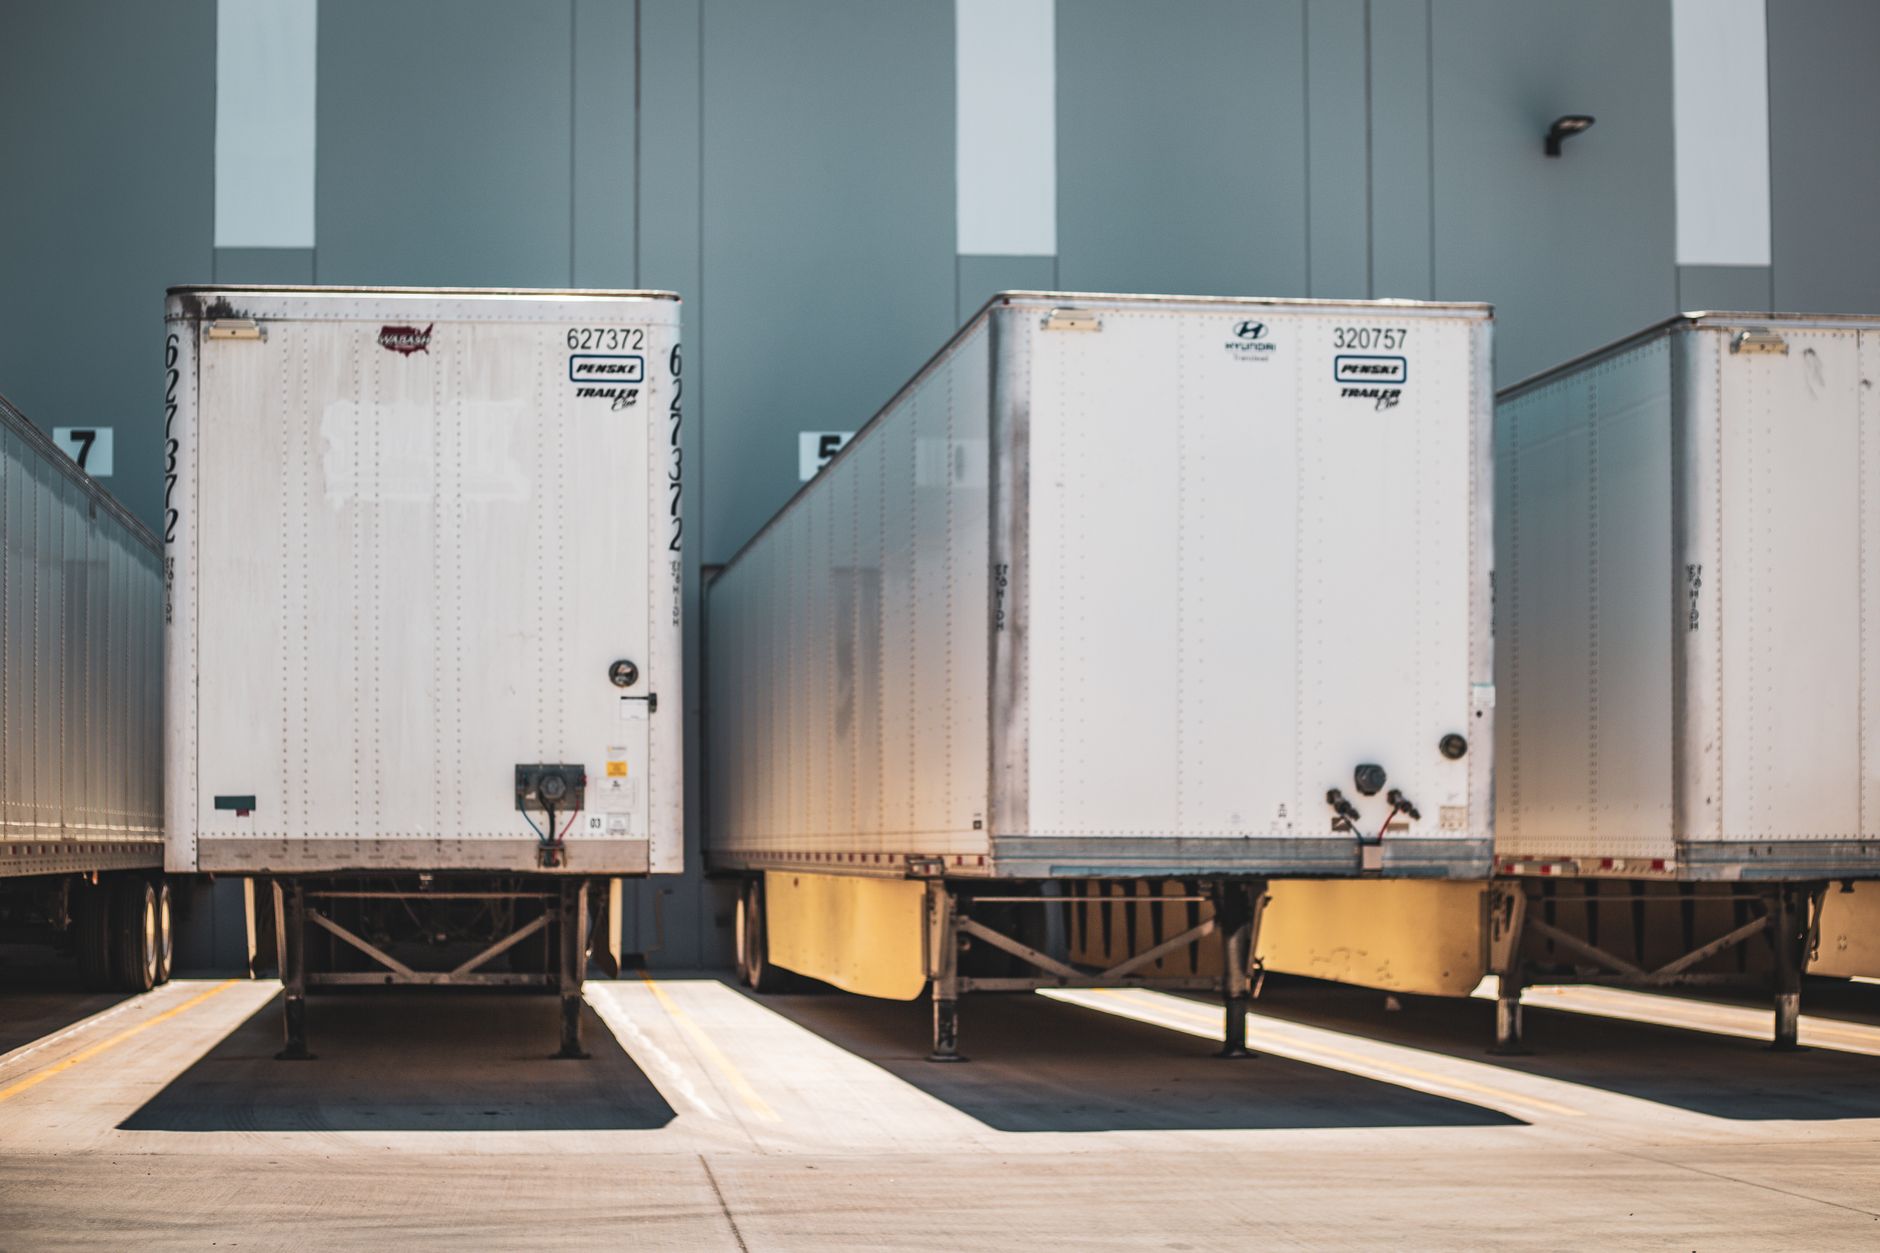
The first risk is safety. According to the Bureau of Labor Statistics, 5,070 workers died from work injuries in the US in 2024, down 4.0 percent from 5,283 in 2023, across all industries. The National Safety Council reports that forklifts were the source of 84 work-related deaths in 2024. Those two figures explain why safety shapes the plan from the start.
A safety training site's summary of OSHA estimates puts forklift injuries at about 35,000 serious and 62,000 non-serious per year, with about 1.5 million workers operating about 855,900 powered industrial trucks. That summary is secondary, so treat the numbers as indicative and check the original estimate before citing them. According to the same summary, powered industrial trucks are covered under 29 CFR 1910.178, which requires examination before trucks are placed in service.
Other risks to the return include a route that fails in practice, aisles blocked by staging, no backup coverage when the unit is down, and staff not trained on exception handling. Each is avoided by choosing routes from measured data, keeping marked clear zones, planning for backup coverage and training staff before go live.
What does the timeline from assessment to payback look like?
The sequence runs from site assessment to quote, then integration, training, go live and a measured period of operation. The assessment maps routes, checks floor and dock conditions and records current hours. The quote follows, with the fixed lease payment and service terms. We then integrate the unit, train staff and start on the routes with the most covered hours.
Payback is measured on the real hours covered after go live, not on the first week. Early weeks often show lower coverage while routes and exceptions are tuned. We recommend comparing measured hours against the range at fixed checkpoints, so the return is checked against the floor rather than assumed.
Expanding from one unit to more depends on the first results. Starting with one unit on the best-measured route is the lowest-risk way to test the math before adding more.
How do I get a precise figure from a free site assessment?
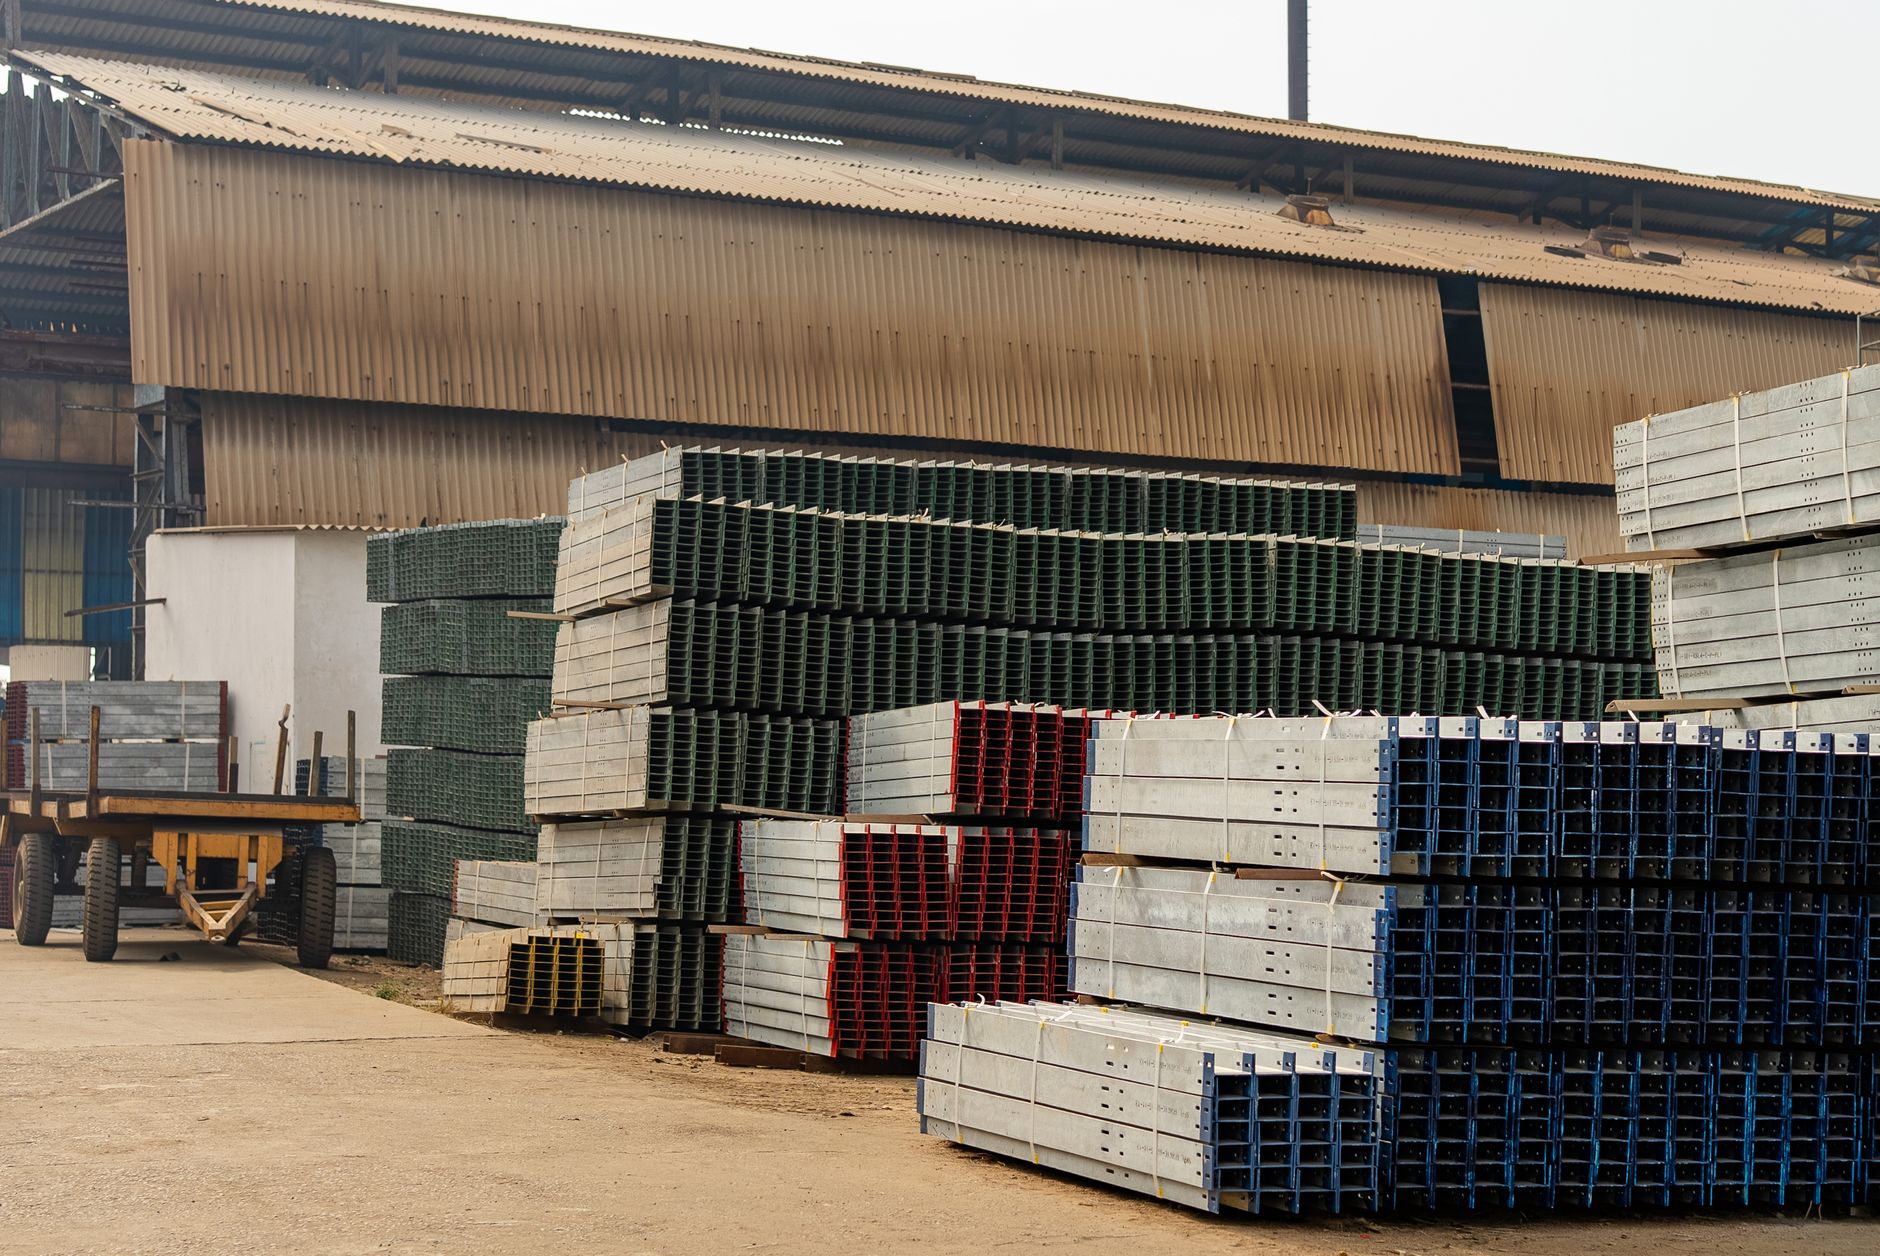
The free site assessment is where the range becomes a figure you can take to a budget meeting. We map the route, measure the legs that repeat, record the hours on each shift and check the floor, aisles and docks. The result is a savings range based on your data, with the fixed lease payment quoted alongside it.
We lease the robot through financing, then deploy, integrate, train your staff and service the unit nationwide. We pick the right robot for the site and remain vendor neutral in that choice, so the recommendation follows the floor rather than a single product line.
Bring your shift schedule, a rough count of daily coil and pallet moves, the routes you already know and any layout drawings you have. Those inputs shorten the assessment and tighten the range.
Frequently asked questions
Want an autonomous forklift at your steel service center?
Tell us about your site. We will recommend the robot, quote the lease, and keep it serviced.
Sources
- US Bureau of Labor Statistics, Occupational Employment and Wage Statistics (OEWS May 2024)
- Vantage Insights, NAICS 423510 Metal Service Centers profile (citing Census County Business Patterns 2023)
- Encyclopedia.com, NAICS 423510 Metal Service Centers and Other Metal Merchant Wholesalers
- IBISWorld, NAICS 423510 Metal Service Centers and Other Metal Merchant Wholesalers
- U.S. Bureau of Labor Statistics, Census of Fatal Occupational Injuries
- National Safety Council, Forklifts injury facts
- Safety training site summary of powered industrial trucks statistics (secondary)
- U.S. Bureau of Labor Statistics, JOLTS, January 2026 release
- A3, Robot orders grow 6.6 percent in 2025