
The short answer
Cleaning robot ROI for bowling centers comes from floor hours taken off janitorial work on concourse and walkway floors, run during quiet hours between league nights and peak periods. The savings range depends on how much of that floor work a robot realistically takes, the hours that work represents, and a fixed robot lease payment quoted after a free site assessment. Treat any figure as a range until the floor is mapped and measured.
Key takeaways
- Floor hours taken off janitorial work are the return, not front-of-house staff.
- Only the share of floor work a robot realistically takes counts toward savings.
- Quiet windows between league nights and peak periods decide how much a robot can run.
- Lease cost is a fixed robot lease payment quoted after a free site assessment.
- Treat every figure as a range until a pilot measures the real hours.
Run the numbers for your site
Pick your city or state for a real regional number - we use the real BLS wage there. (On the live site this auto-detects from your location.)
What do you want to automate?
The robot runs the open floor overnight; your crew keeps detail and edges.
What is cleaning robot ROI for bowling centers?
Cleaning robot ROI for bowling centers is the return from letting a floor robot take over part of the janitorial work on concourse and walkway floors, so staff hours go to tasks that need a person. It is not a return from cutting lane or front-desk staff, and a sound estimate treats it that way. The number is built from three inputs: the hours of floor work taken off staff, the share of that work a robot realistically handles, and a fixed robot lease payment.
The setting is a shrinking one, which makes every recurring labor line worth checking. According to IBISWorld, there were an estimated 2,541 bowling center businesses in the US in 2025, down 2.1 percent from 2024, and the firm projects 2,484 for 2026. IBISWorld also reports that the number of US bowling alleys has fallen 32 percent since 2005. These are industry estimates, not a government count, so read them as direction rather than an exact total.
IBISWorld's employment estimate puts about 61,879 people in bowling centers in 2026, roughly 24.9 employees per business across all roles. That covers the whole staff, including lanes, food and bar, and management, so it is not a janitorial headcount and this page does not treat it as one.
Where does the return come from in a bowling center?
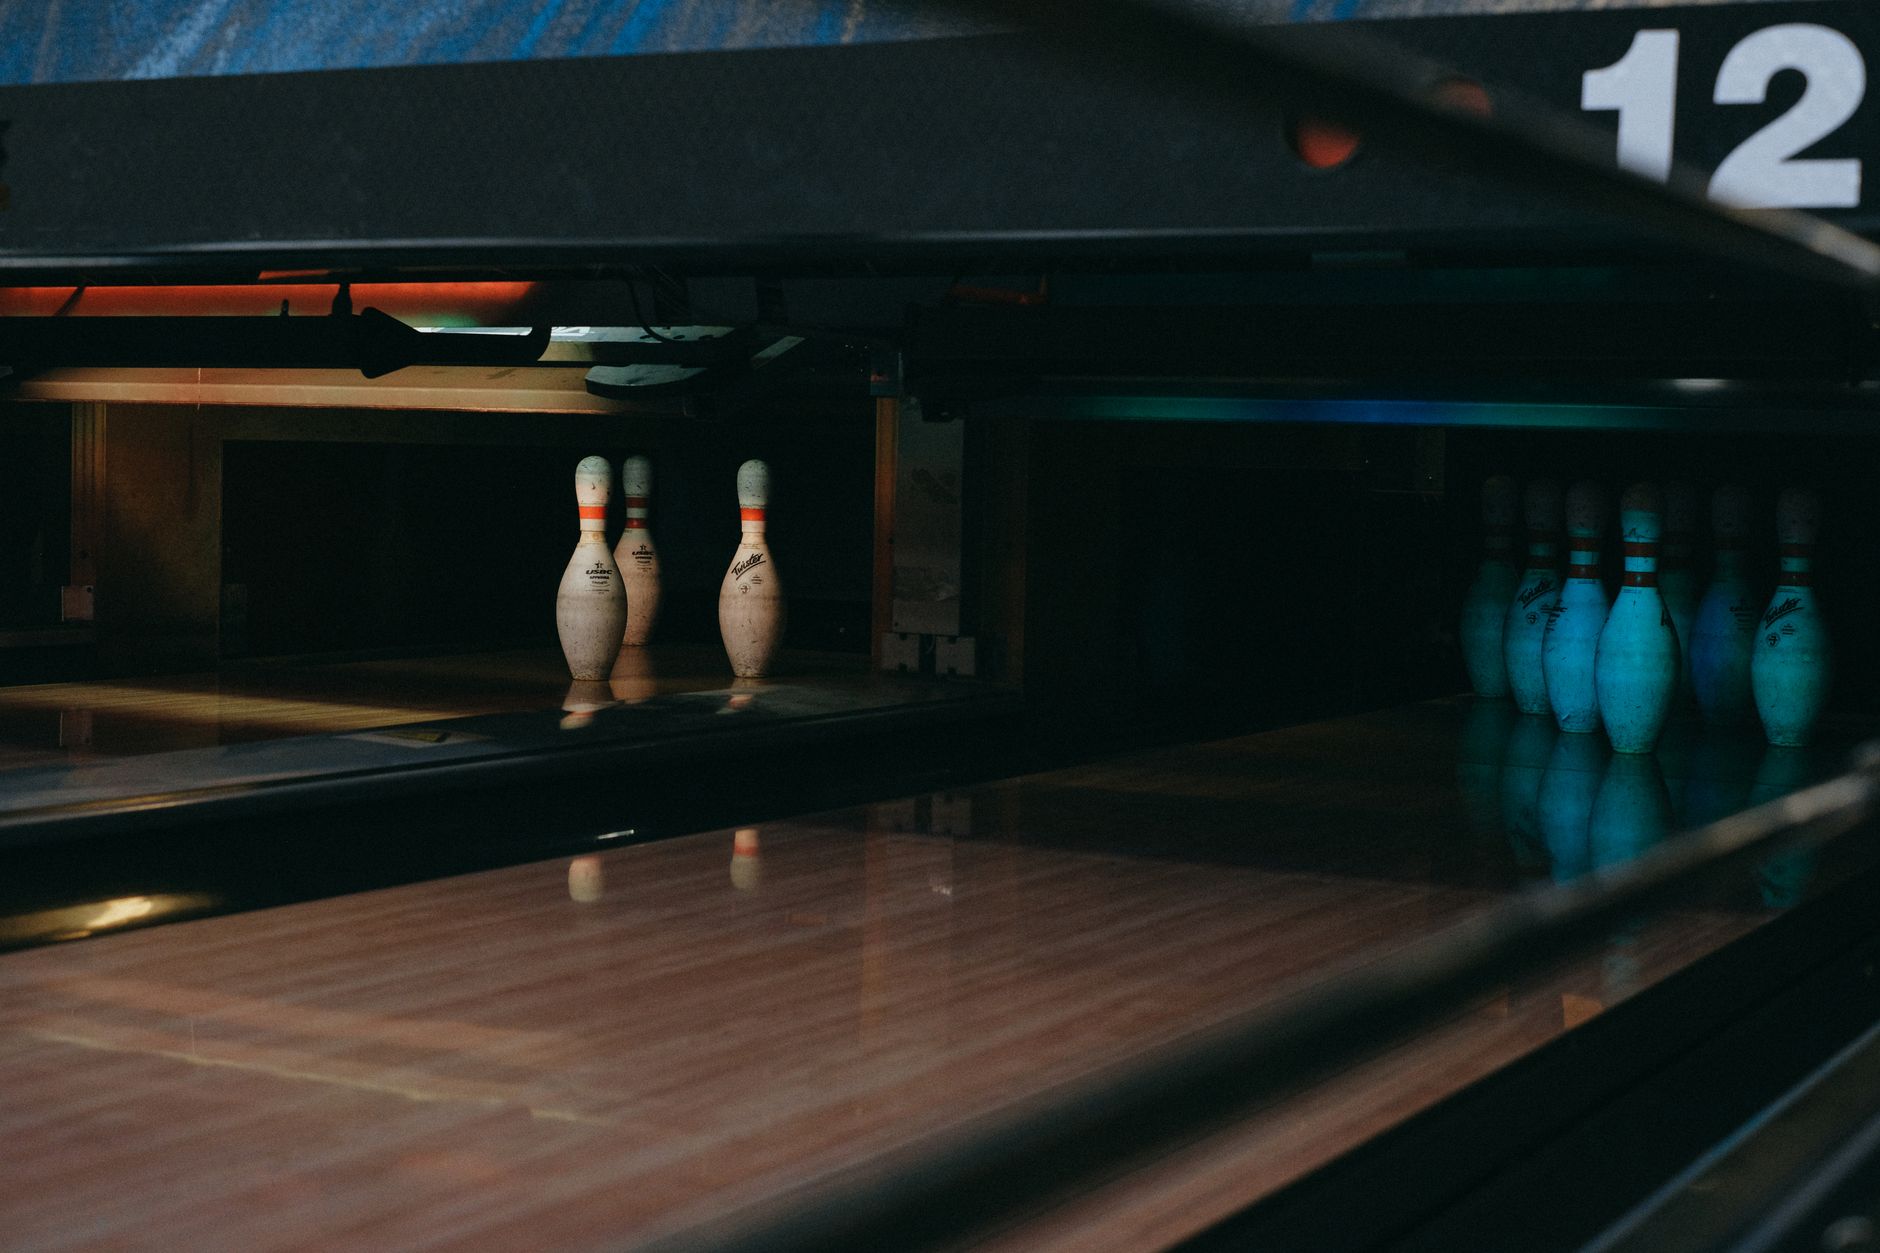
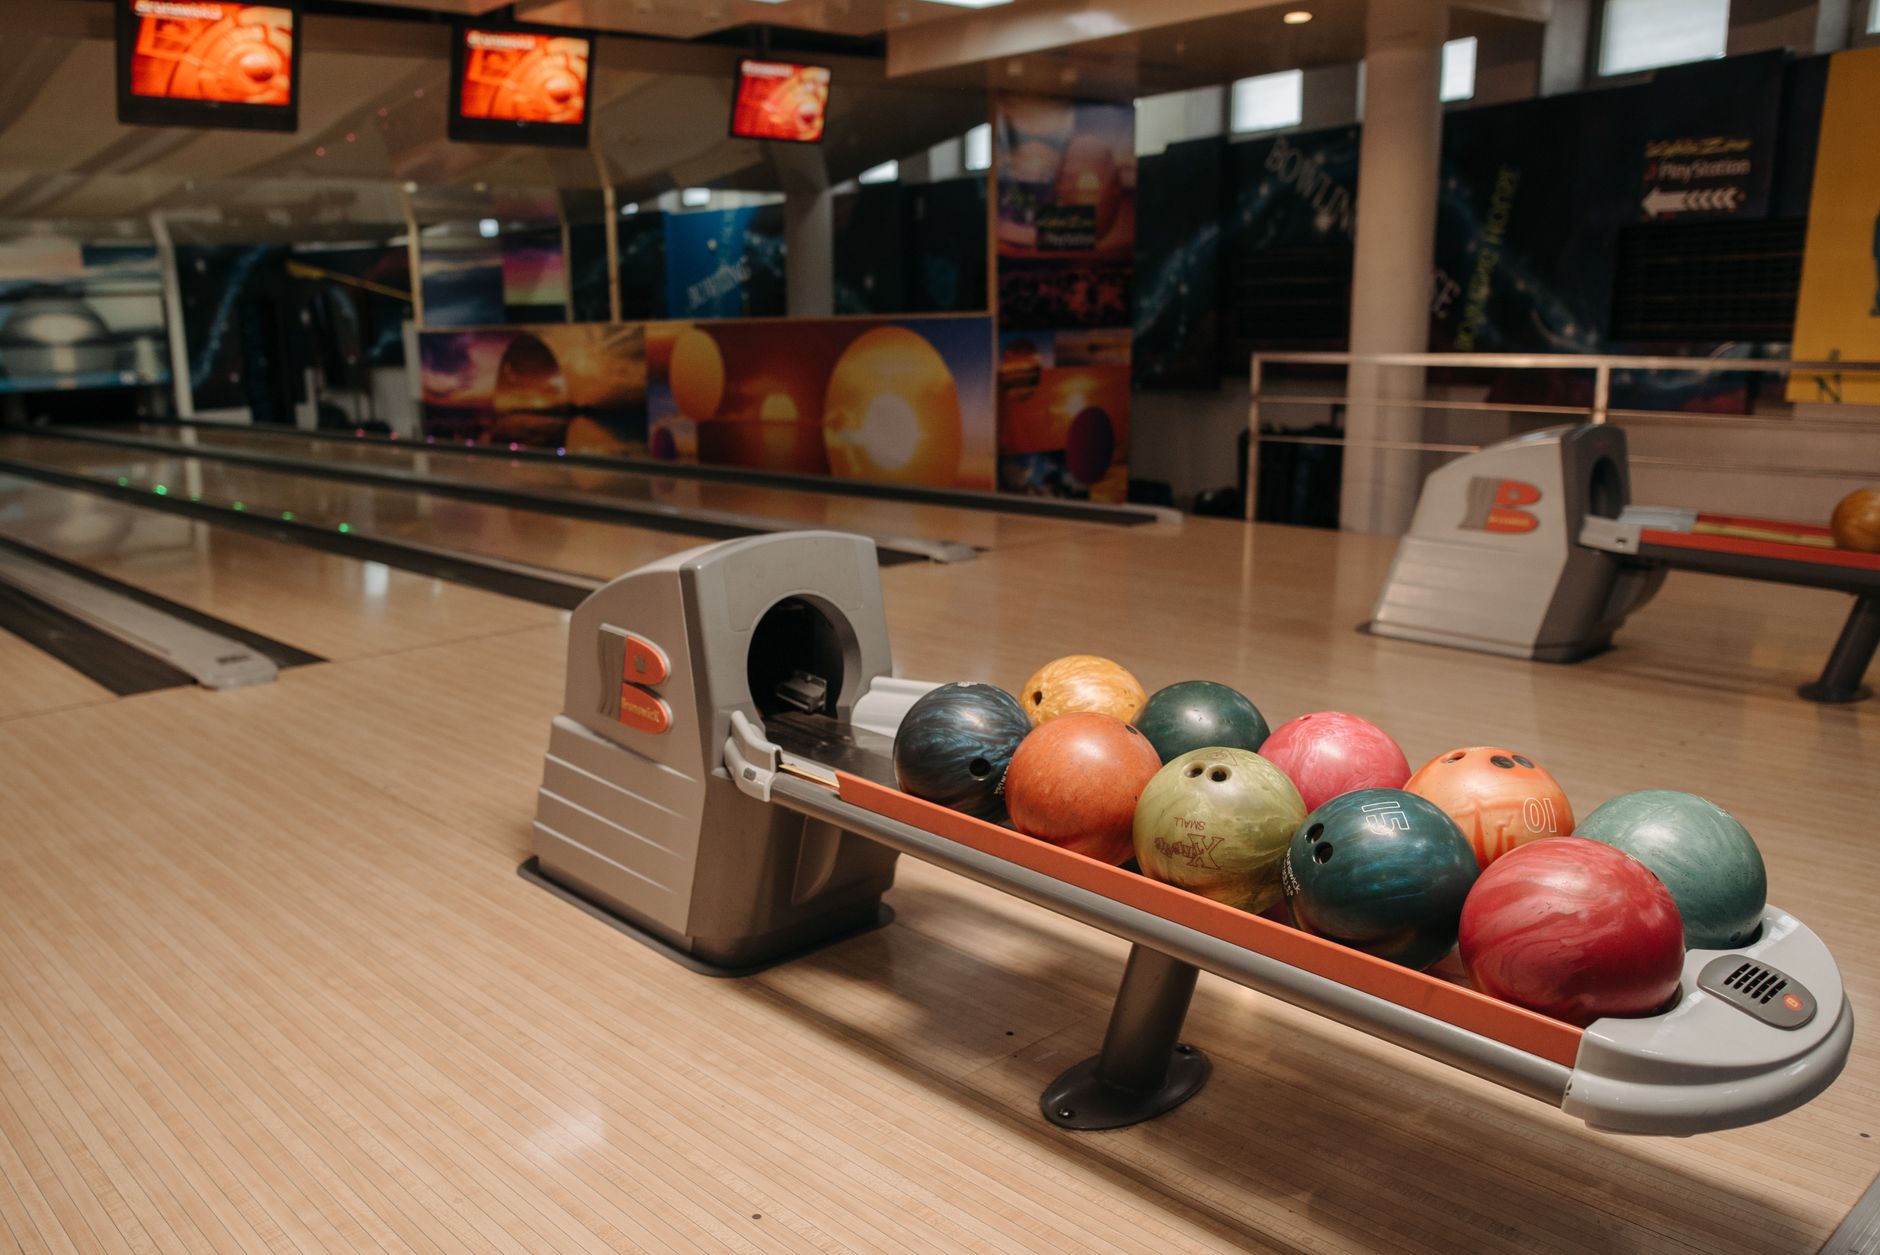
The return sits on the open, high-traffic floor. A bowling center has a large main concourse, walkways to the lanes, the shoe counter area, and food and bar corridors. These floors take heavy foot traffic through the day and need repeated sweeping and scrubbing to stay safe and presentable. Floor care is routine work that a floor robot handles well when the route is fixed and the path is clear.
Timing is the other half of the return. Bowling centers run on a rhythm of quiet hours, league nights and peak weekend periods. A robot earns its keep in the windows when the floor is less crowded, often early in the day or after close, and the site assessment decides which windows are usable. Zones with heavy traffic during peak stay with staff.
The job type matters for the math. According to the Bureau of Labor Statistics Occupational Outlook Handbook, about 2,447,700 people held janitor and building cleaner jobs in 2024, and the handbook projects 2 percent growth from 2024 to 2034, slower than average for all occupations. Floor sweeping and scrubbing is that kind of work, so the savings side of the calculator is priced on it. The government wage data on this page reflects that job. Lane, food and bar staff do other work, and this page does not price their time.
Median hourly wage, Janitors and Building Cleaners
$4,041
Monthly cost of one full-time worker, at the median wage plus payroll costs (an estimate, not a quote).
How is the savings range calculated?
The calculator works in hours first. Start with the hours per week that staff spend on floor work in the zones a robot can cover. Multiply that by the share the robot realistically takes, which is less than the total because some tasks stay with people, such as spill response, edge detail and handling exceptions. Then price those hours at the local wage for this job from the government wage data on this page.
Subtract the fixed robot lease payment, the service and maintenance coverage, and the staff time spent on setup, route checks and exceptions. What remains is the savings range. It is a range because each input moves. The hours are estimates, the share is uncertain until the robot runs on the actual floor, and the lease is quoted after the site assessment.
Payback is the point where cumulative net savings cover startup and integration. A useful output is a band with a low case and a high case, with the assumptions for each written down so the owner can see which one drives the result.
How many hours of floor work does a robot take over?
Start with the manual baseline. A trade press article reports that a walk-behind machine cleans about 999 square feet per hour, and a rider about 22,989 square feet per hour. The gap between those two rates shows how much the machine type changes the hours. Apply the rate to the measured floor, not to a rough guess about the building.
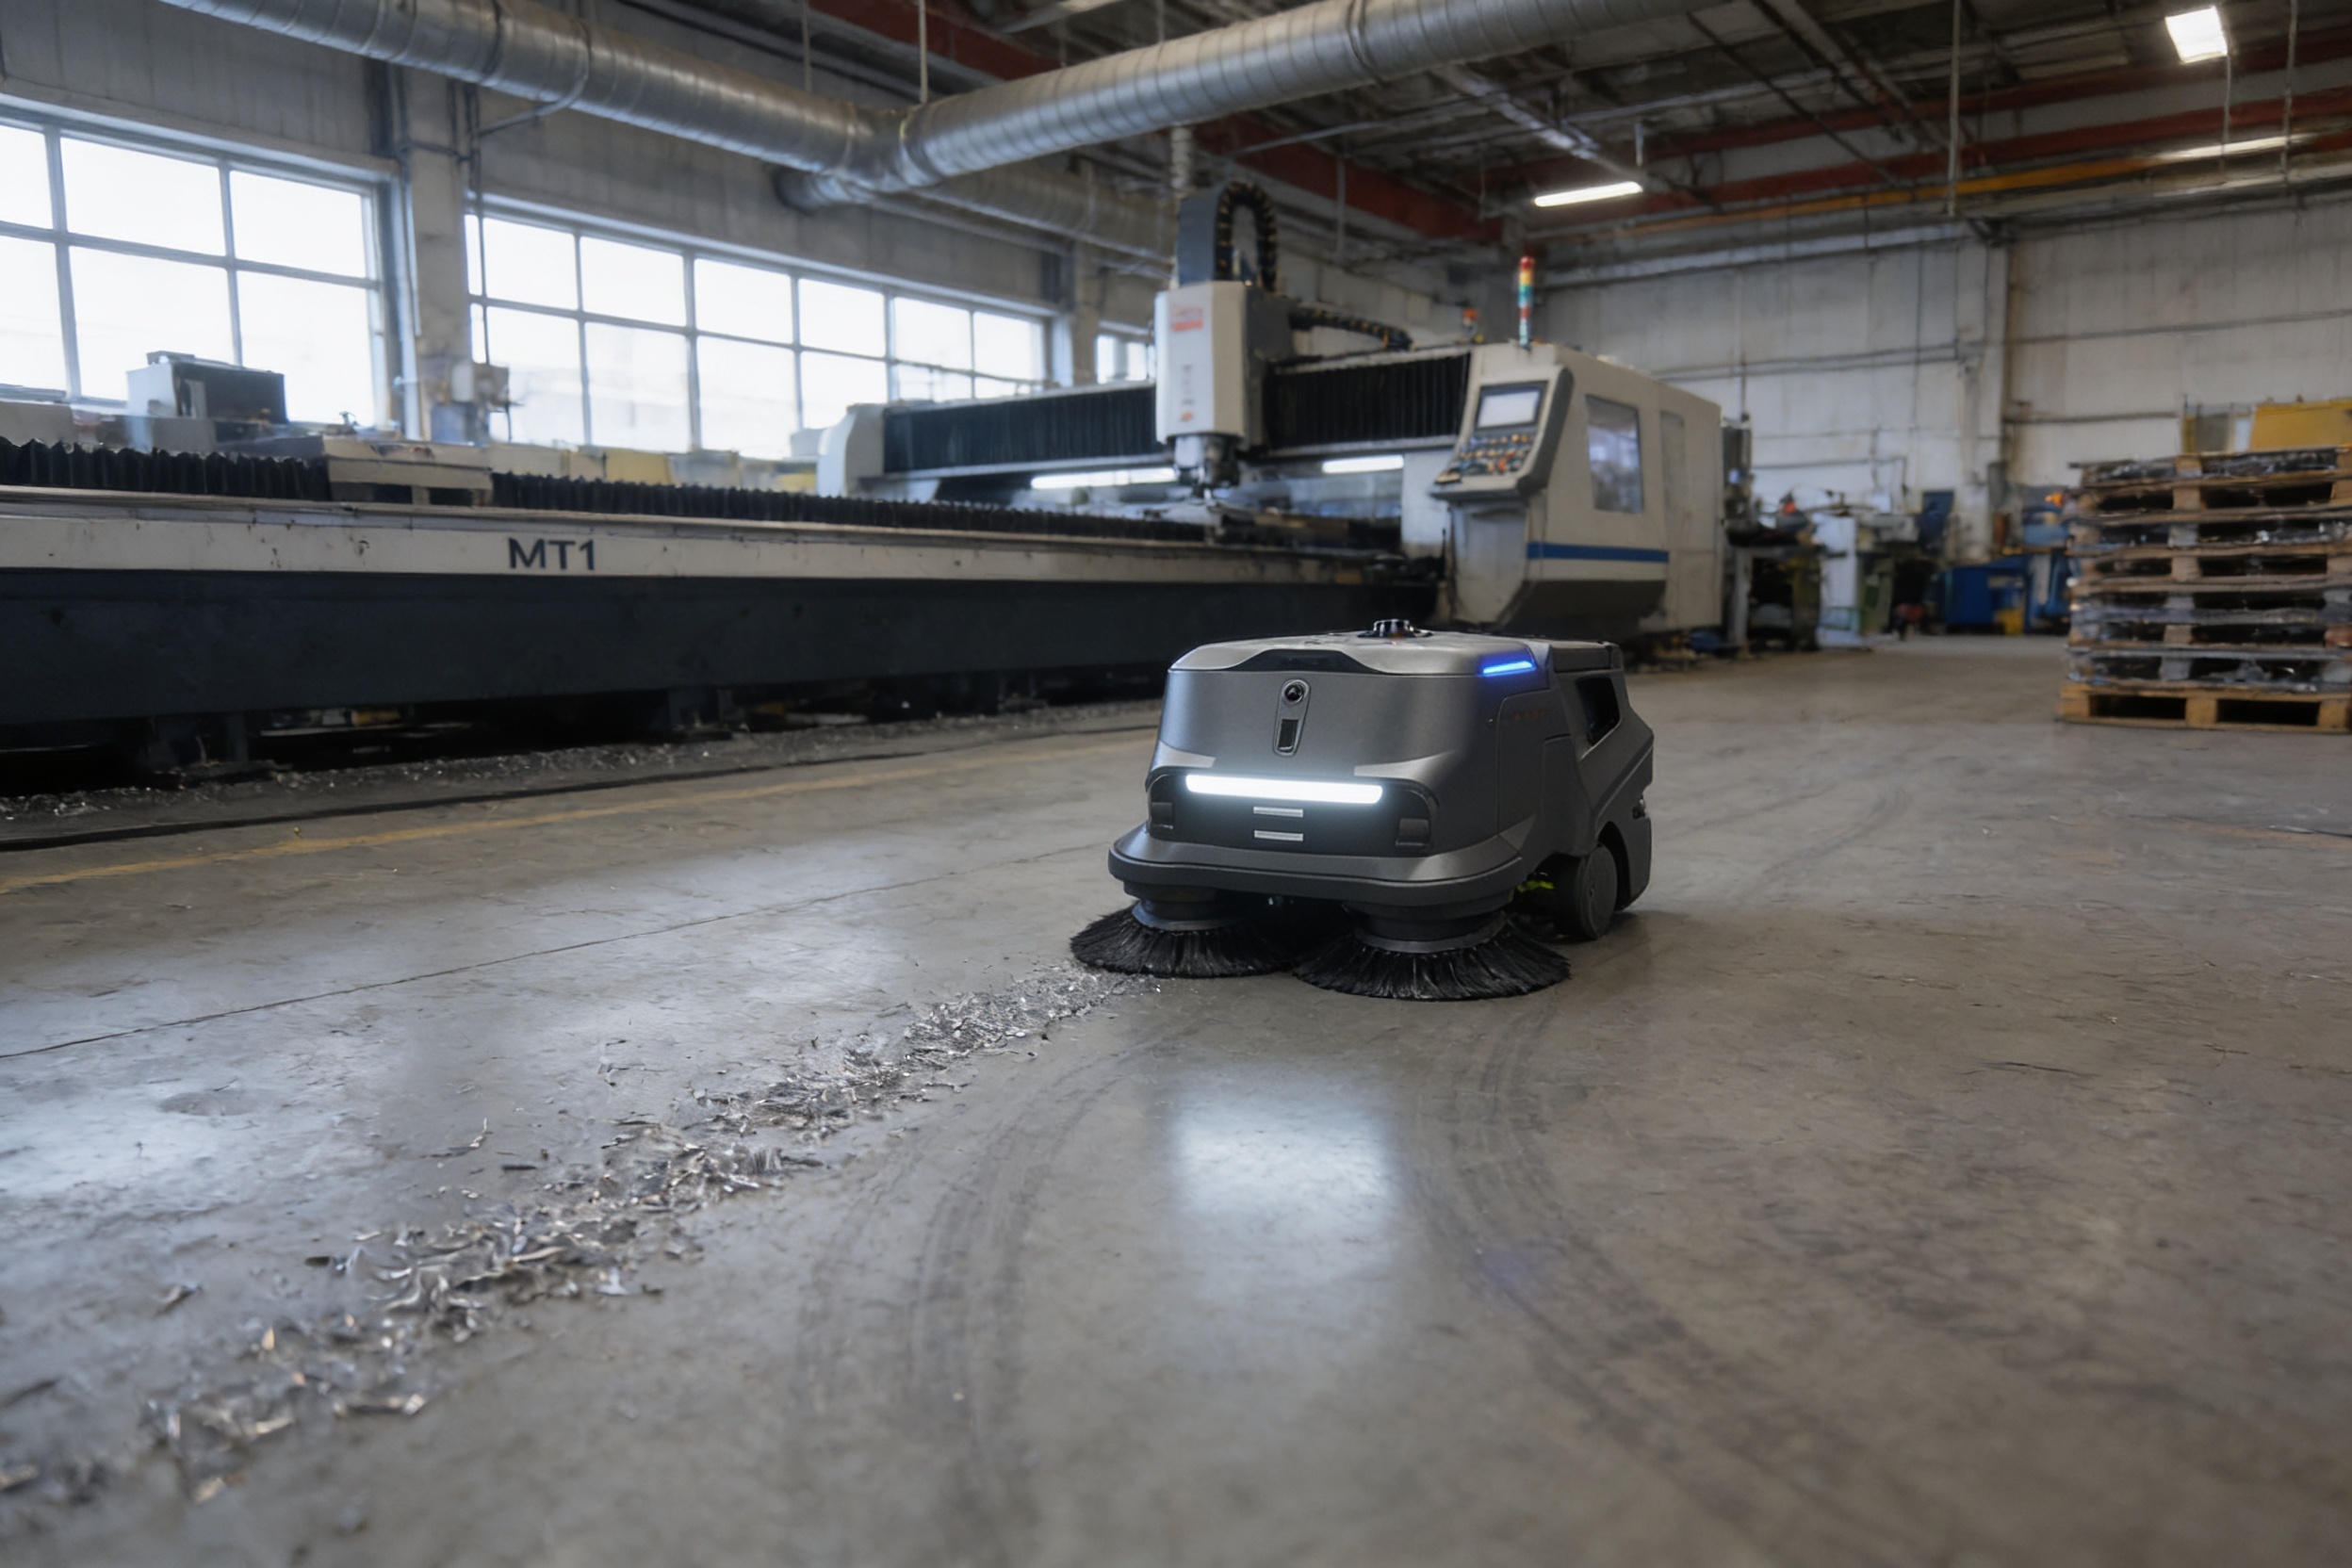
For robot runs, the best field-style figure in the research is a vendor case study of a large school district fleet. It reports 14 autonomous floor scrubbers averaging about 90 minutes of cleaning per unit per day, covering about 20,000 square feet per unit per run, and more than 2,220 autonomous run hours across the year. That source is vendor-reported and comes from a school setting, so use it as a planning reference, not as a bowling center result.
No published survey of cleaning hours per shift at bowling centers was found. The table below uses an example 20,000 square foot concourse to show the arithmetic only. The site assessment replaces the example with the measured floor.
Robot or person: which does floor care better?
The honest comparison is not robot against person. Each does different work well, and the useful question is which tasks move to the robot during the windows where a robot can run. The table below sets out where each one wins.
- Quiet-hour coverage
Cleaning Robot
Runs a fixed route in quiet windows with no crew on the floor
Staff
Needs paid hours in the same window, plus travel between zones
- Consistency
Cleaning Robot
Same route and pass count each run, with the run logged
Staff
Varies with the person, the shift and the day
- Spills and detail work
Cleaning Robot
Weak on sudden spills, gum and corners it cannot reach
Staff
Handles spills, gum, edges and odd debris well
- Exceptions and judgment
Cleaning Robot
Stops or flags blocked paths and needs staff to clear them
Staff
Adapts on the spot to crowds, mess and changing layouts
- Flexibility
Cleaning Robot
Limited to mapped routes and open floor
Staff
Can move to other tasks on the same shift
- Cost structure
Cleaning Robot
Fixed robot lease payment plus service coverage
Staff
Hours that move with shifts, absences and training
What changes the number up or down?
Upward pressure comes from a large, open floor that runs clean in long quiet windows, from existing staff hours already spent on that floor, and from a fixed route that repeats the same way every night. Each of those lets the robot take a larger share of the total. A clear layout with few obstacles also helps, because stopped runs cost time.
Downward pressure comes from short quiet windows, cluttered floors, uneven transitions between zones, frequent spills that need a person, and seasonal events that change the layout. A bowling center that rearranges its floor for tournaments or parties will need route changes, and those changes take staff time that the calculator must include.
The fastest way to settle the range is a pilot. Start with one leased unit on the highest-value zone, measure the hours it actually takes and the share of floor work it truly handles, then decide whether to expand. Measured numbers replace estimates in the second half of the calculation.
What are the risks to the return and how do you avoid them?

The biggest risk is an overstated share. If the calculator assumes the robot takes the whole floor, the savings look large and staff still spend time on the edges, spills and exceptions. Avoid this by pricing the share from the pilot, not from a brochure. The second risk is an unmapped route that stops often, which adds staff time for clearing paths and cuts the hours saved.
Injury context matters for the case you make to leadership. The BLS industry profile for the amusement, gambling and recreation subsector, which includes bowling centers, lists 3.3 total recordable cases per 100 full-time workers, 1.9 for cases with days away, job restriction or transfer, and 1.1 for days away from work. The California state table for the same subsector lists 4.5 total recordable cases per 100 full-time workers for 2024.
Those rates cover the whole subsector, not janitorial work, so they do not measure the risk a floor robot removes. They do show the setting carries injury risk, and fewer manual passes by staff is a reasonable goal. No figure in the research quantifies that reduction, so count it as a qualitative benefit, not as part of the savings range.
What is a realistic timeline from assessment to payback?
The sequence runs from a free site assessment to a quote, then to financing, deployment and training, then to a measured pilot period, and only then to a payback estimate based on real hours. Each step depends on the one before. The assessment maps the floor and quiet windows, the quote follows the mapping, and the financing review follows the quote.
Deployment includes route setup and integration with the site, plus staff training on operation, route checks and exception handling. Go-live support runs alongside the first operating period, so the team can correct routes and timing while the real hours are measured. Dates are set in the assessment plan, since the site schedule and the financing review decide how fast the work moves.
Payback is calculated only after the measured period. Before that, any payback figure is a projection. The useful habit is to set the measurement window in advance and to review the measured hours against the range on this page.
How do you get a precise figure from a free site assessment?
Service Robot Co. is a US commercial robot integrator. We pick the robot that fits the site, lease it through financing, deploy and integrate it, train staff, and service it nationwide. The free site assessment maps the floor areas, records quiet windows and obstacles, and captures the hours staff spend on floor work today. That is the input the calculator needs.
To get the most from the assessment, bring a floor plan or let the team map it, your league and peak calendar, the zones you want covered, and the present floor hours by shift. Note any tournament or event setups that change the layout, since those change the route. Staff who know the spill patterns and the busiest corners help the team set the boundaries.
The output is a fixed robot lease payment quoted after the assessment, a range built on measured inputs with a low and high case, and a plan for the pilot. Owners can then compare that range against the present labor line and decide with real numbers rather than an estimate.
Frequently asked questions
Want a cleaning robot at your bowling center?
Tell us about your site. We will recommend the robot, quote the lease, and keep it serviced.
Sources
- US Bureau of Labor Statistics, Occupational Employment and Wage Statistics (OEWS May 2024)
- IBISWorld, bowling centers business count (industry estimate)
- IBISWorld, bowling centers employment (industry estimate)
- Bureau of Labor Statistics, Occupational Outlook Handbook, janitors and building cleaners
- Bureau of Labor Statistics, industry profile for amusement, gambling and recreation (NAICS 713)
- California Department of Industrial Relations, 2024 injury table
- Vendor case study, school district autonomous floor scrubber fleet
- Trade press article on manual floor cleaning rates