

The short answer
Cleaning robot ROI for urgent care clinics comes from janitorial hours taken off hard floors, so clinical staff stay with patients while corridors and waiting rooms are cleaned on a schedule. The size of the return depends on the hard-floor area, the hours the clinic runs, the share of that work a robot can realistically take and the lease cost, so the savings range on our calculator is a range and not a promise. The exact lease payment is quoted after a free site assessment that measures your floors.
Key takeaways
- The return comes from janitorial hours on hard floors, not from pulling clinical staff off patient care.
- The share of floor work a robot takes is measured on site, not assumed from a general estimate.
- The Check In reports 15,309 urgent care centers at the close of 2025, so the setting is large.
- Lease cost is set against those hours, with setup and exception time counted on the cost side.
- Payback depends on your floor area and hours, so the site assessment sets the date.
Run the numbers for your site
Pick your city or state for a real regional number - we use the real BLS wage there. (On the live site this auto-detects from your location.)
What do you want to automate?
The robot runs the open floor overnight; your crew keeps detail and edges.
What is cleaning robot ROI for urgent care clinics?
Cleaning robot ROI for urgent care clinics is the return from taking repeated hard-floor cleaning off the hours staff already work. In a clinic that work is mostly corridor passes, waiting room floors and check-in areas, and it repeats through the day. The return is the janitorial hours the robot takes over, set against the lease payment and the staff time the robot still needs for setup, checks and exceptions.
The return is not one fixed figure. Two clinics with the same floor plan can land far apart, because the hours they spend on floors, the share a robot can take and the lease terms all vary. This page explains the math and the drivers, so the savings range on our calculator is easier to read.
Our calculator for this setting is pre-filled with urgent care assumptions. It produces a savings range, not a promise, and the lease payment is a fixed payment quoted only after a free site assessment.
Where does the return come from in an urgent care clinic?
The first source is floor work that repeats every day. Waiting rooms and patient corridors take foot traffic from opening to closing, and the people walking through them track in dust, grit and wet spots. Someone has to keep those surfaces clean through the day. That is the janitors and building cleaners type of work a robot takes over.
The second source is staff focus. A clinic is mainly staffed by medical assistants, nurses and front desk roles. A 2021 study in BMC Health Services Research, with 61 respondents, lists a mean of 5.7 medical assistants and 3.1 nurses per site. When floors fall to those people, they leave patient care or check-in to do the work. A scheduled robot pass keeps them where they are needed. We do not price their time in the savings range. The range prices only the janitorial hours the robot takes over.
The third source is consistency. A scheduled pass runs the same route at the same times, including on busy days when a person would normally be pulled to something else. That consistency helps the operation, but it is hard to put into hours, so treat it as support for the number rather than part of it.
Median hourly wage, Janitors and Building Cleaners
$4,041
Monthly cost of one full-time worker, at the median wage plus payroll costs (an estimate, not a quote).
How many urgent care clinics are there in the US, and how busy are they?
The Check In, published by the Urgent Care Association, reports 15,309 urgent care centers at the close of 2025, up from 15,032 in January 2025. The UCA urgent care data page lists a 2025 total of 15,101, so the counts differ slightly and depend on how a center is defined.
Volume is the other side of the picture. The UCA data page reports average daily visits per center of 33.13 in 2023, 33.27 in 2024 and 33.96 in 2025, and says more than 185 million patients are cared for in urgent care settings each year. An average hides spread, so the UCA 2023 White Paper adds that median daily visits per center were 40 in 2022, and it describes that figure as a median and not an average.
Adoption is moving in the wider sector. FM Business Daily reports a 34% increase in robotics adoption in global facilities management over the prior year, with cleaning services leading. It did not give a healthcare-specific rate. An older AACEM and ISSA autonomous cleaning survey found about one-third of non-adopters were somewhat likely to adopt within a year, a finding that predates the present wave.
These figures describe a large and busy setting. They do not show how many floor hours a given clinic runs, which is why the site assessment measures the floor directly.
How does the savings math work?
The math has four parts. First, the hours of janitorial work on hard floors at your site. Second, the share of those hours a robot realistically takes over. Third, the value of those hours at the local wage for this job, which the government wage data on this page shows. Fourth, the lease cost plus the staff time still needed for setup, checks and exceptions. The savings range is the spread between the value of the hours taken and the total cost of running the robot.
The labor side is priced in janitors and building cleaners hours, because that is the work the robot takes. The Bureau of Labor Statistics Occupational Outlook Handbook reports about 2.4 million jobs in this occupation in 2024, with projected growth of 2% for 2024 to 2034, which the handbook describes as slower than average. It projects about 47,800 new jobs and about 351,300 openings a year from replacement needs, and says entry is mostly short-term on-the-job training. Those are national figures, not clinic figures.
The research for this page found no verified count of janitorial staff per urgent care clinic. The calculator therefore starts from one cleaning role per site, and the assessment replaces that with your real count. The IBISWorld industry estimate of 32.3 employees per urgent care business covers all roles and can span several clinics, so it does not give a per-site cleaning figure.

How much janitorial work does a robot actually take over?
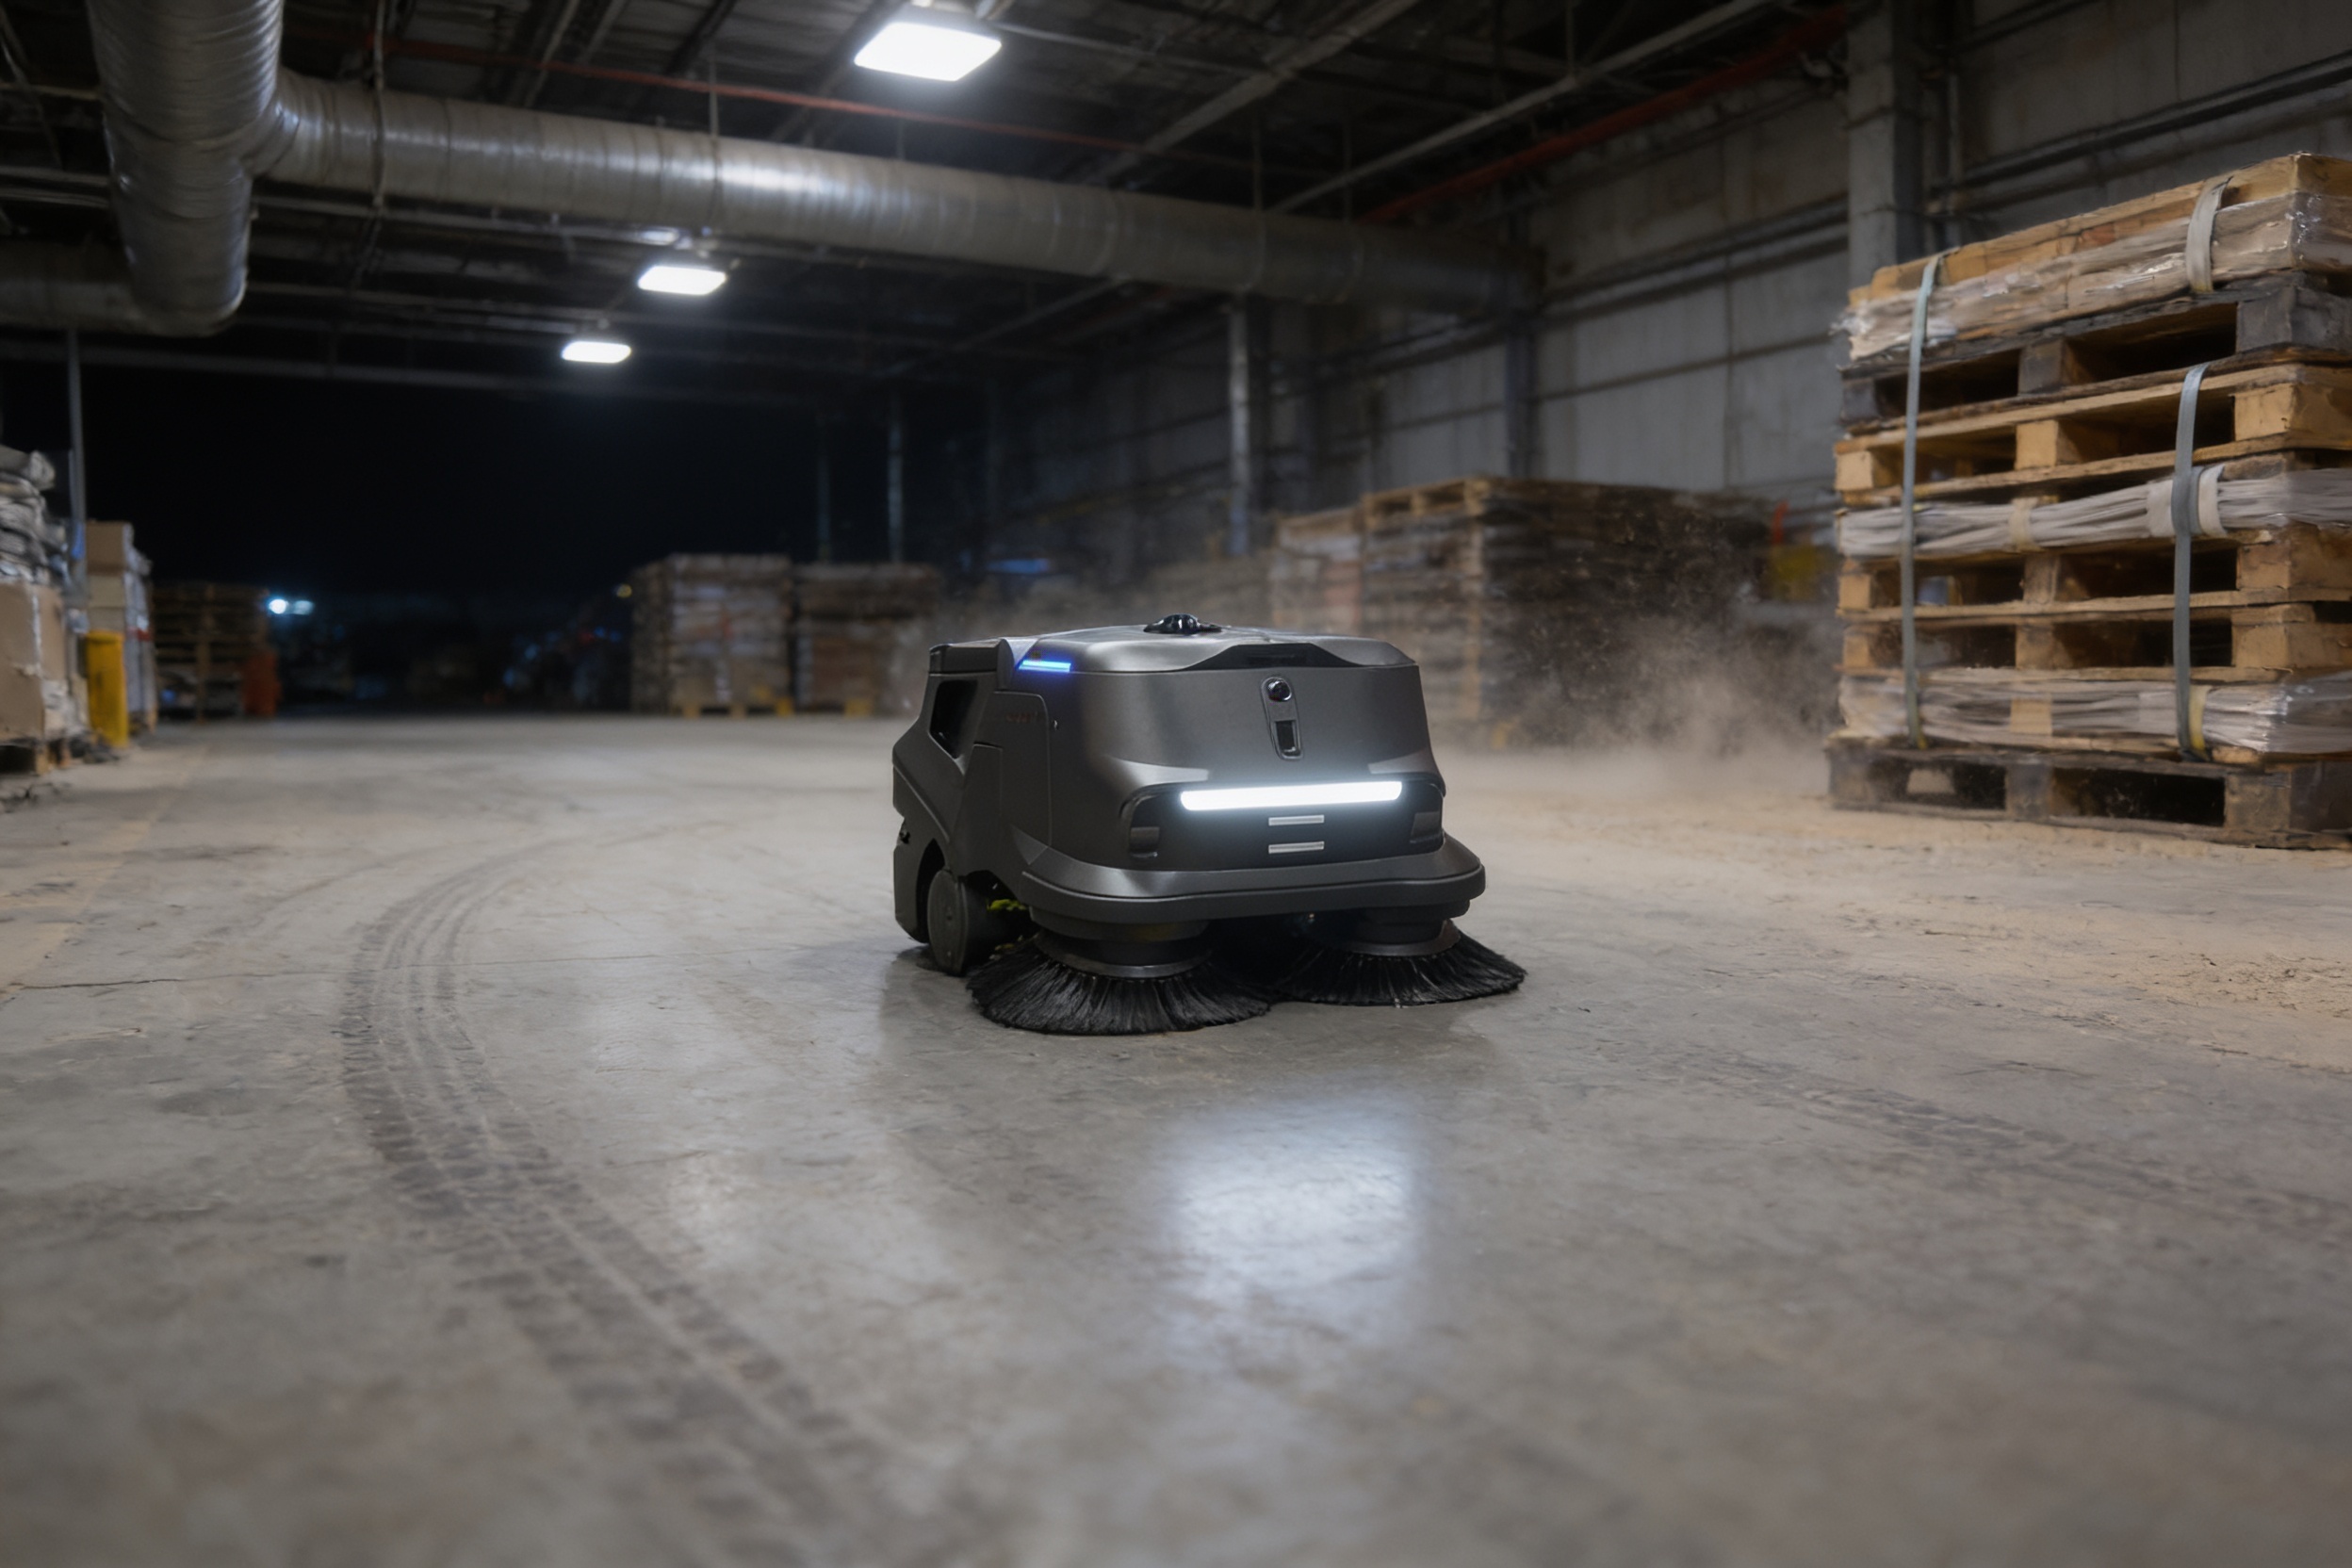
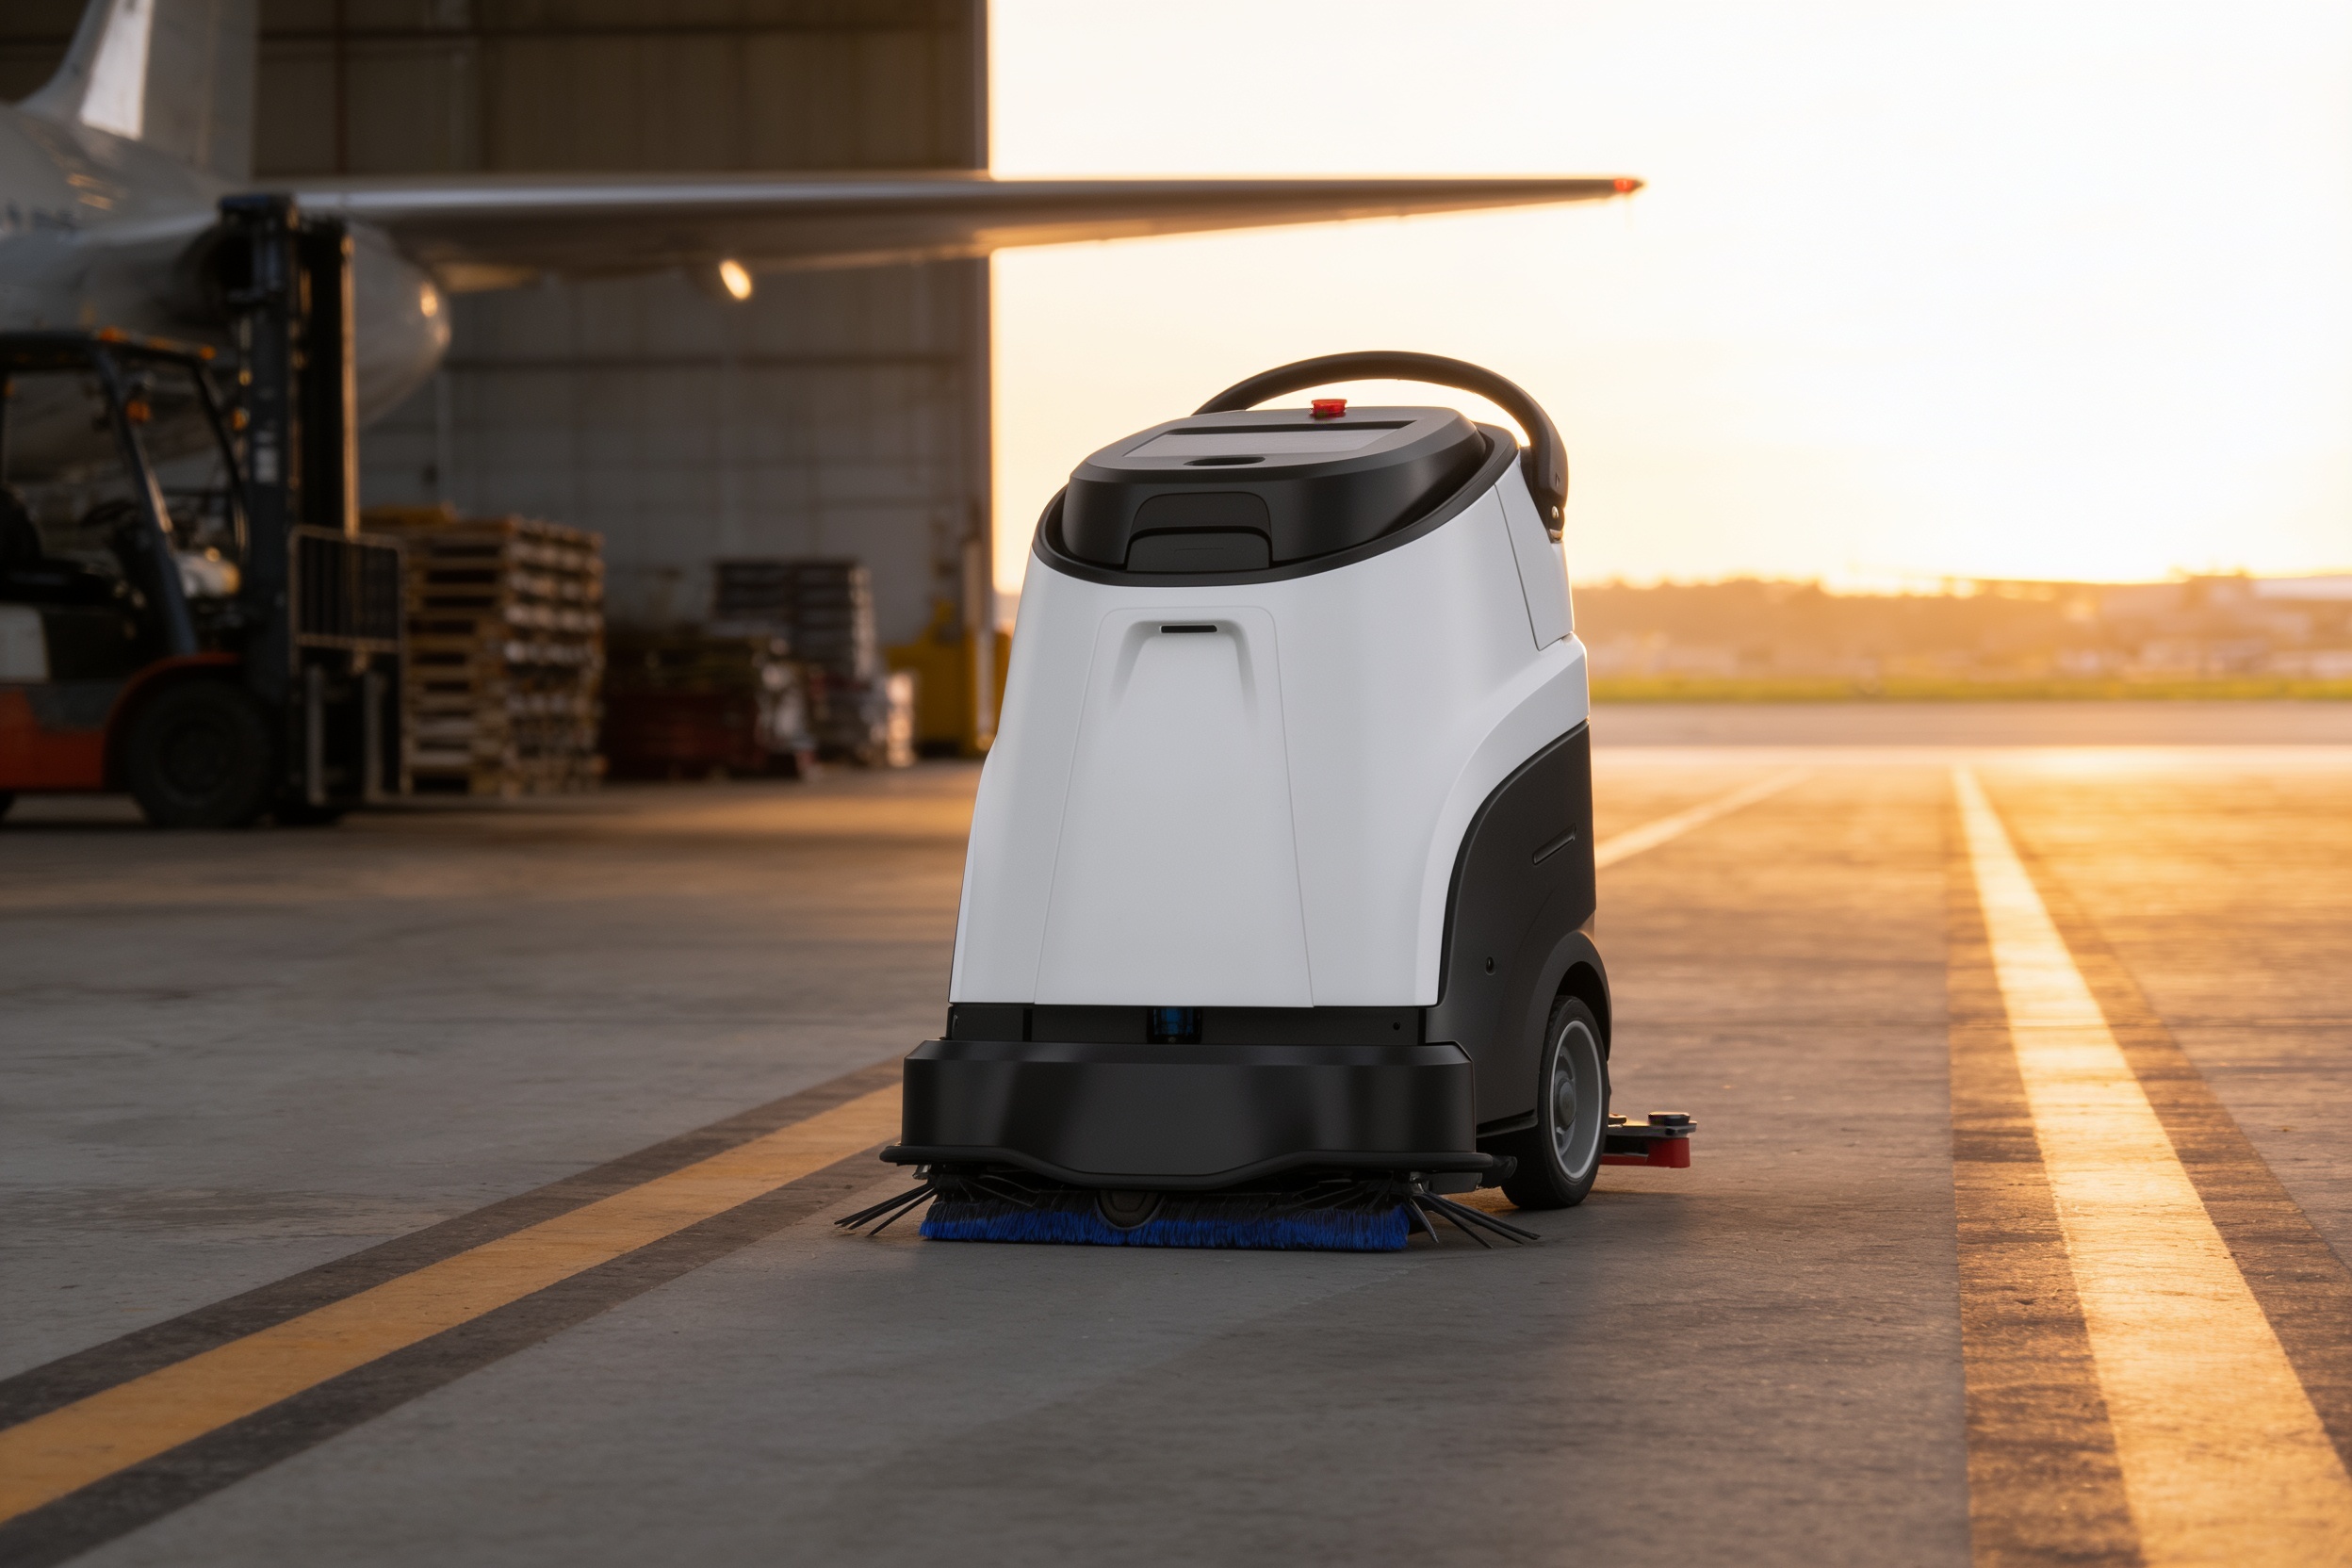
Not every floor task is a robot task. Corridor and waiting room passes are repeatable, run on hard surfaces and follow a route. Restroom cleaning, spill response, wiping after procedures, high-touch disinfection and edges around fixed furniture stay with staff. The realistic share is the part of the hard-floor work that fits a route, not the whole janitorial workload.
We did not find a verified figure for minutes per shift of corridor and waiting room cleaning in clinics, so this page does not give one. The table lists each task and how its hours are measured, rather than an estimate we cannot source. The site assessment times the real passes on your floors and records the staff time for every other task.
We also found no verified injury or incident rate for cleaning robots or for clinic janitors. This page therefore makes no safety claim based on a rate. Ask for the safety procedures and route rules in writing during the assessment.
| Task | Today | With a robot |
|---|---|---|
| Corridor passes | Timed on site across a busy day | Route set once, staff check at start of shift |
| Waiting room floor passes | Timed on site, including peak arrivals | Scheduled route, staff check after busy periods |
| Entry and lobby floors | Timed on site after tracked-in traffic | Scheduled pass, staff clear spills first |
| Restroom cleaning | Staff time, measured in the assessment | Stays with staff |
| Spill response and wiping after procedures | Staff time, logged when it happens | Stays with staff |
No verified hours per shift were found for hard-floor cleaning in urgent care, so the today column names how each figure is measured instead of stating one. The site assessment fills in real minutes from your floors and staff logs.
What changes the number up or down?
Four things move the range most: the hard-floor area the route covers, the hours the clinic runs each day, how much of the work fits a route, and the lease terms. Large hard-floor waiting areas with clear sightlines push the number up. Carpet, raised thresholds and crowded furniture pull it down, because those surfaces and obstacles limit which passes a robot can take.
Operating hours matter too. A site that can run passes after closing, or in quiet windows between peaks, can often schedule the robot without adding staff. Daily visit volume matters as well. The UCA data page reports an average of 33.96 daily visits per center in 2025, which is a starting point, and a busier building may generate more floor traffic than that average. Confirm the real number with your own counts, not the average.
Staff time moves the number the other way. Setup, route tuning, daily checks and exception handling offset the hours taken over, and a clinic that underestimates them will see a smaller return than the first estimate suggested.
What are the risks to the return, and how do you avoid them?
The most common risk is overestimating the share of work. If the robot is scoped to take all floor work, staff will still be doing restroom and spill tasks, and the range will look better than the building supports. Scope the route to the passes that repeat, and count staff time for everything else.
The second risk is layout change. Clinics reconfigure waiting rooms, add chairs and move check-in lines. A route mapped on day one can drift out of fit. Plan a remap after any major change, and name one staff member who owns the schedule and the route after go-live.
The third risk is treating a floor robot as infection control. It cleans floors on a route. Disinfection and infection control protocols remain the clinic's responsibility, and this page makes no claim that the robot replaces them.
What is the realistic timeline from assessment to payback?

The sequence runs from a site assessment to a mapped route, a quote with a fixed lease payment, deployment and integration, staff training and go-live support. The assessment sets the baseline, so the payback date is only as firm as the hours measured on site. Expect the first weeks after go-live to show setup time and route tuning, which belong on the cost side of the math.
Phased deployment is the usual approach in clinics. Starting with one unit on the busiest corridor lets staff see the work before the route expands, and the building stays open throughout. Payback follows once the measured hours taken over exceed the lease cost plus the staff time still needed. The research for this page did not verify a payback period for urgent care, so this page does not state one. The assessment produces a date built on your own measurements.
Plan the timeline around your change calendar. Avoid a go-live in the same week as a waiting room remodel, and schedule the first remap for after the new layout settles.
How do you get a precise figure from a free site assessment?
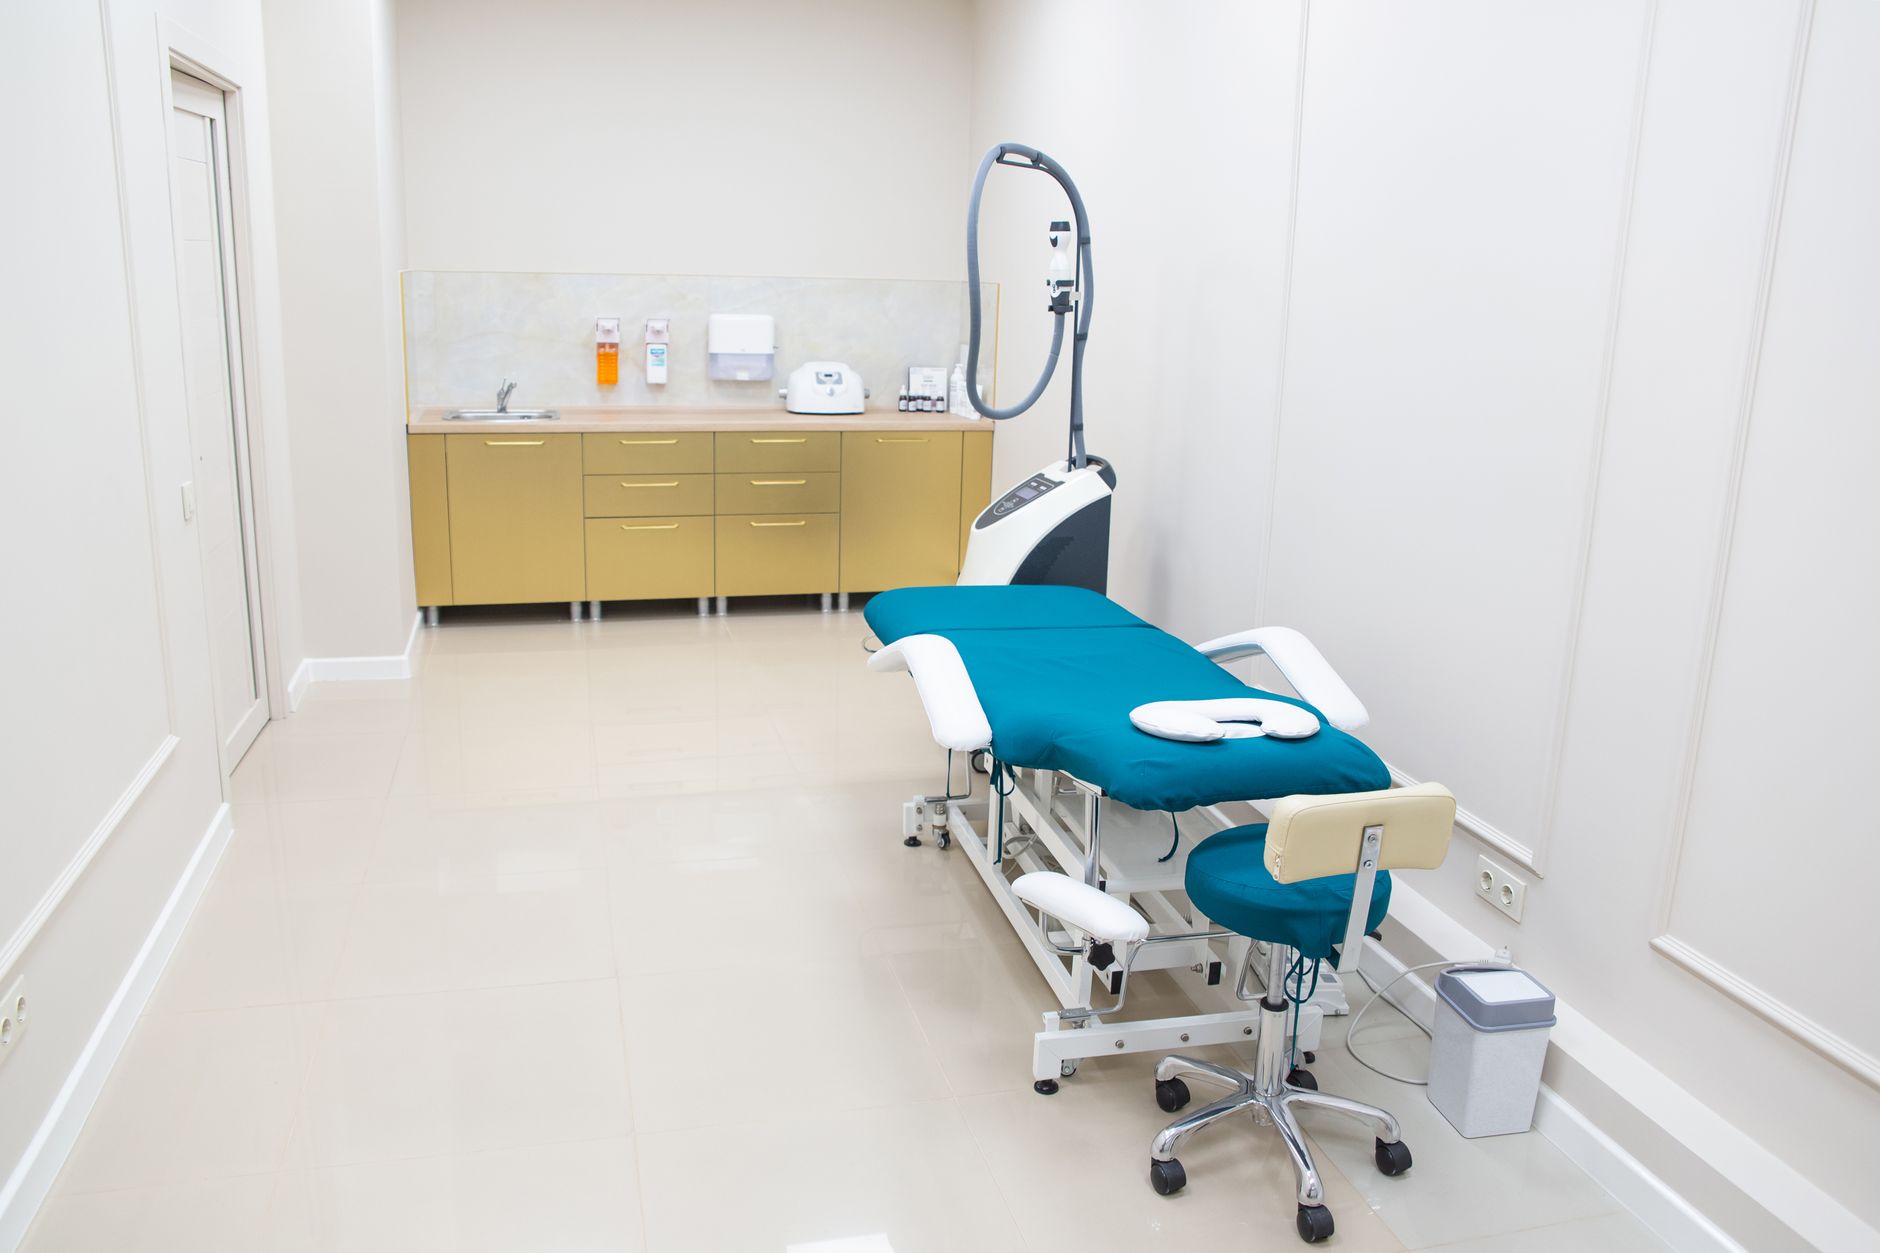
A free site assessment is the step that turns the range into your figure. We map the hard-floor area, time the existing passes, confirm which tasks fit a route, and mark the zones the robot can work without blocking patient movement. The output is a savings range built on your hours, a fixed lease payment quote and a deployment plan.
Bring the cleaning schedule you have now, a floor plan with hard surfaces marked, the hours the clinic runs, and any layout changes planned for the next year. Ask for the lease terms in writing, including what service is covered, how on-site dispatch works and what happens when a unit needs repair. We service nationwide, so the same process applies in any state, and we can discuss spare unit coverage for a site that cannot wait for a repair.
Once the quote is in hand, compare it against the staff hours the assessment measured, not against a general estimate. The precise figure is the one that holds up against your own floor and your own schedule.
Frequently asked questions
Want a cleaning robot at your urgent care clinic?
Tell us about your site. We will recommend the robot, quote the lease, and keep it serviced.
Sources
- US Bureau of Labor Statistics, Occupational Employment and Wage Statistics (OEWS May 2024)
- The Check In, Urgent Care Association
- Urgent Care Association, Urgent Care Data
- UCA 2023 Urgent Care Industry White Paper
- Bureau of Labor Statistics, Occupational Outlook Handbook: Janitors and Building Cleaners
- IBISWorld, Urgent Care Centers in the US
- BMC Health Services Research, 2021 study table
- FM Business Daily, November 2025
- AACEM and ISSA Autonomous Cleaning Survey, FMLink