

The short answer
Cleaning robot ROI for public libraries comes mainly from floor scrubbing hours that move to the overnight period, when no staff are in the building. The savings range depends on how much open floor the robot covers, how many hours your crew spends on that work today, and the lease cost quoted after a site assessment. Expect a range rather than a promise, and check it against your own shift records.
Key takeaways
- The return comes from floor hours moved to overnight, not from cutting the whole cleaning crew.
- Large open reading rooms with clear aisles and hard floors are the strongest fit.
- Set the hour baseline from your own shift logs before you read any savings range.
- Expect a range, and get the lease quote after a free site assessment.
- Budget for setup, mapping and staff checks, since the first weeks carry the most work.
Run the numbers for your site
Pick your city or state for a real regional number - we use the real BLS wage there. (On the live site this auto-detects from your location.)
What do you want to automate?
The robot runs the open floor overnight; your crew keeps detail and edges.
What is cleaning robot ROI for public libraries?
Cleaning robot ROI for public libraries is the return a library gets when a floor scrubbing robot takes over repetitive floor work that staff would otherwise do during paid hours. The return shows up as labor hours moved to the overnight period, set against the lease cost of the equipment. It is a range, not a single figure, because libraries differ widely in size, layout and staffing.
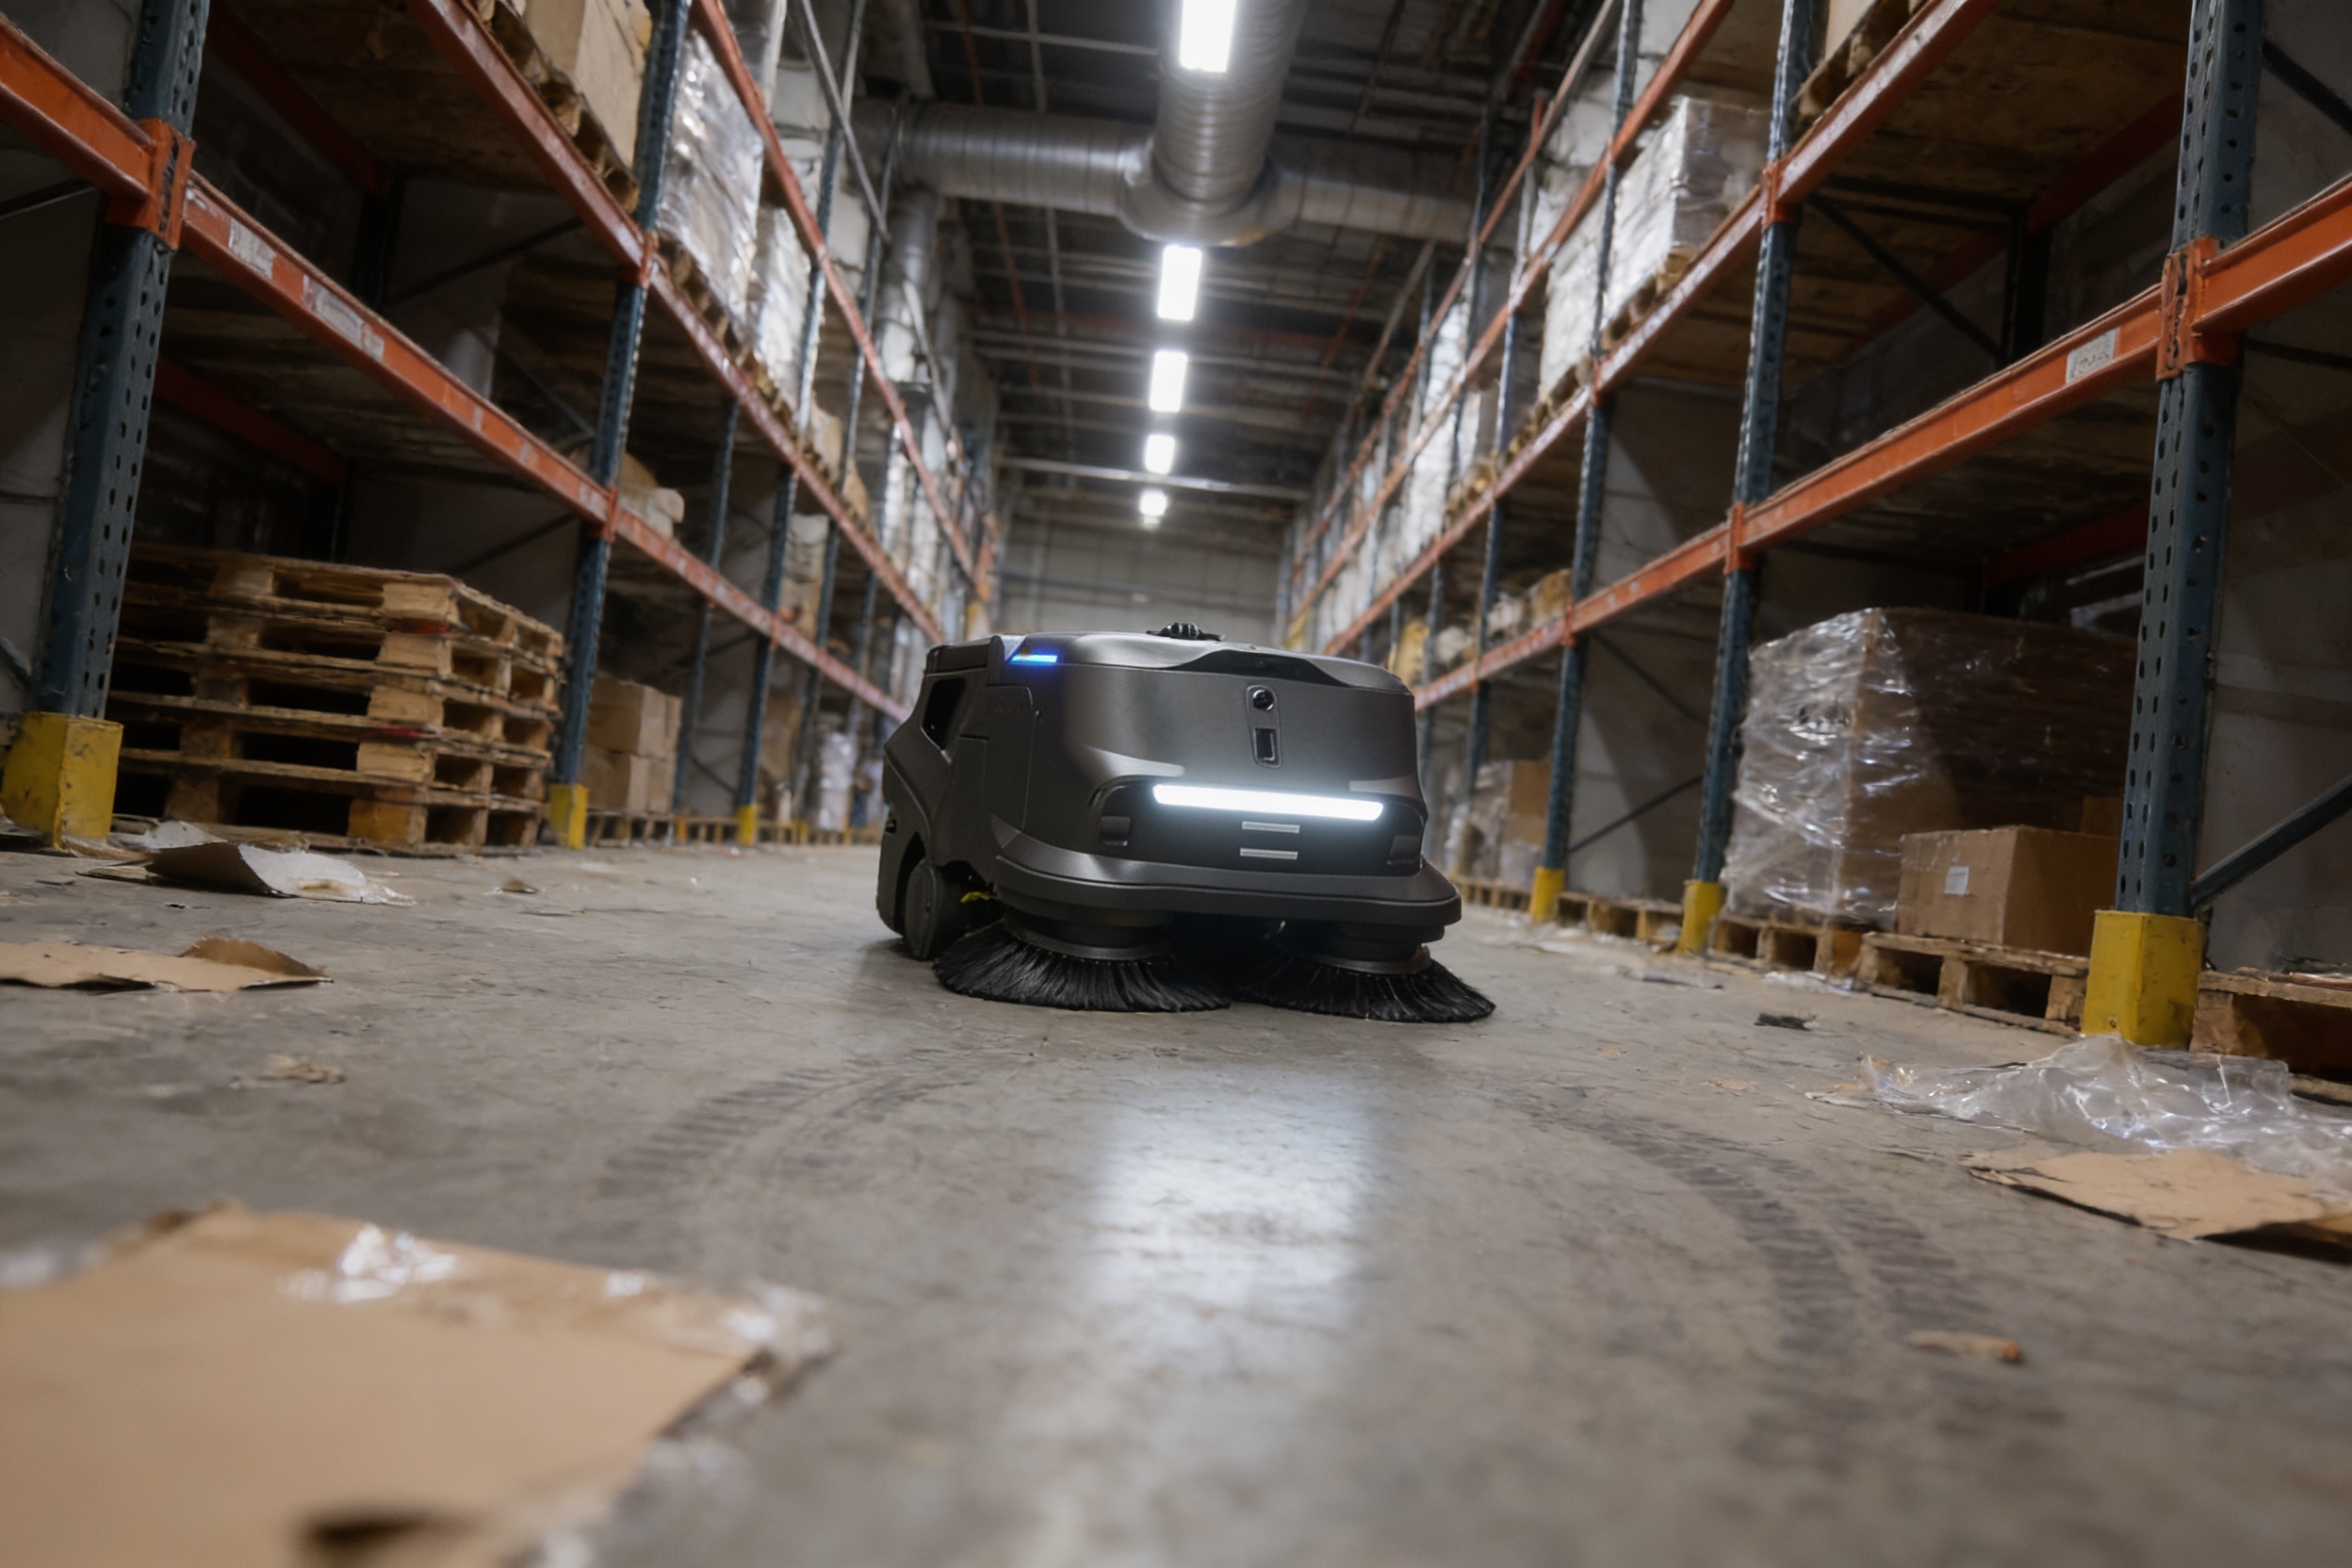
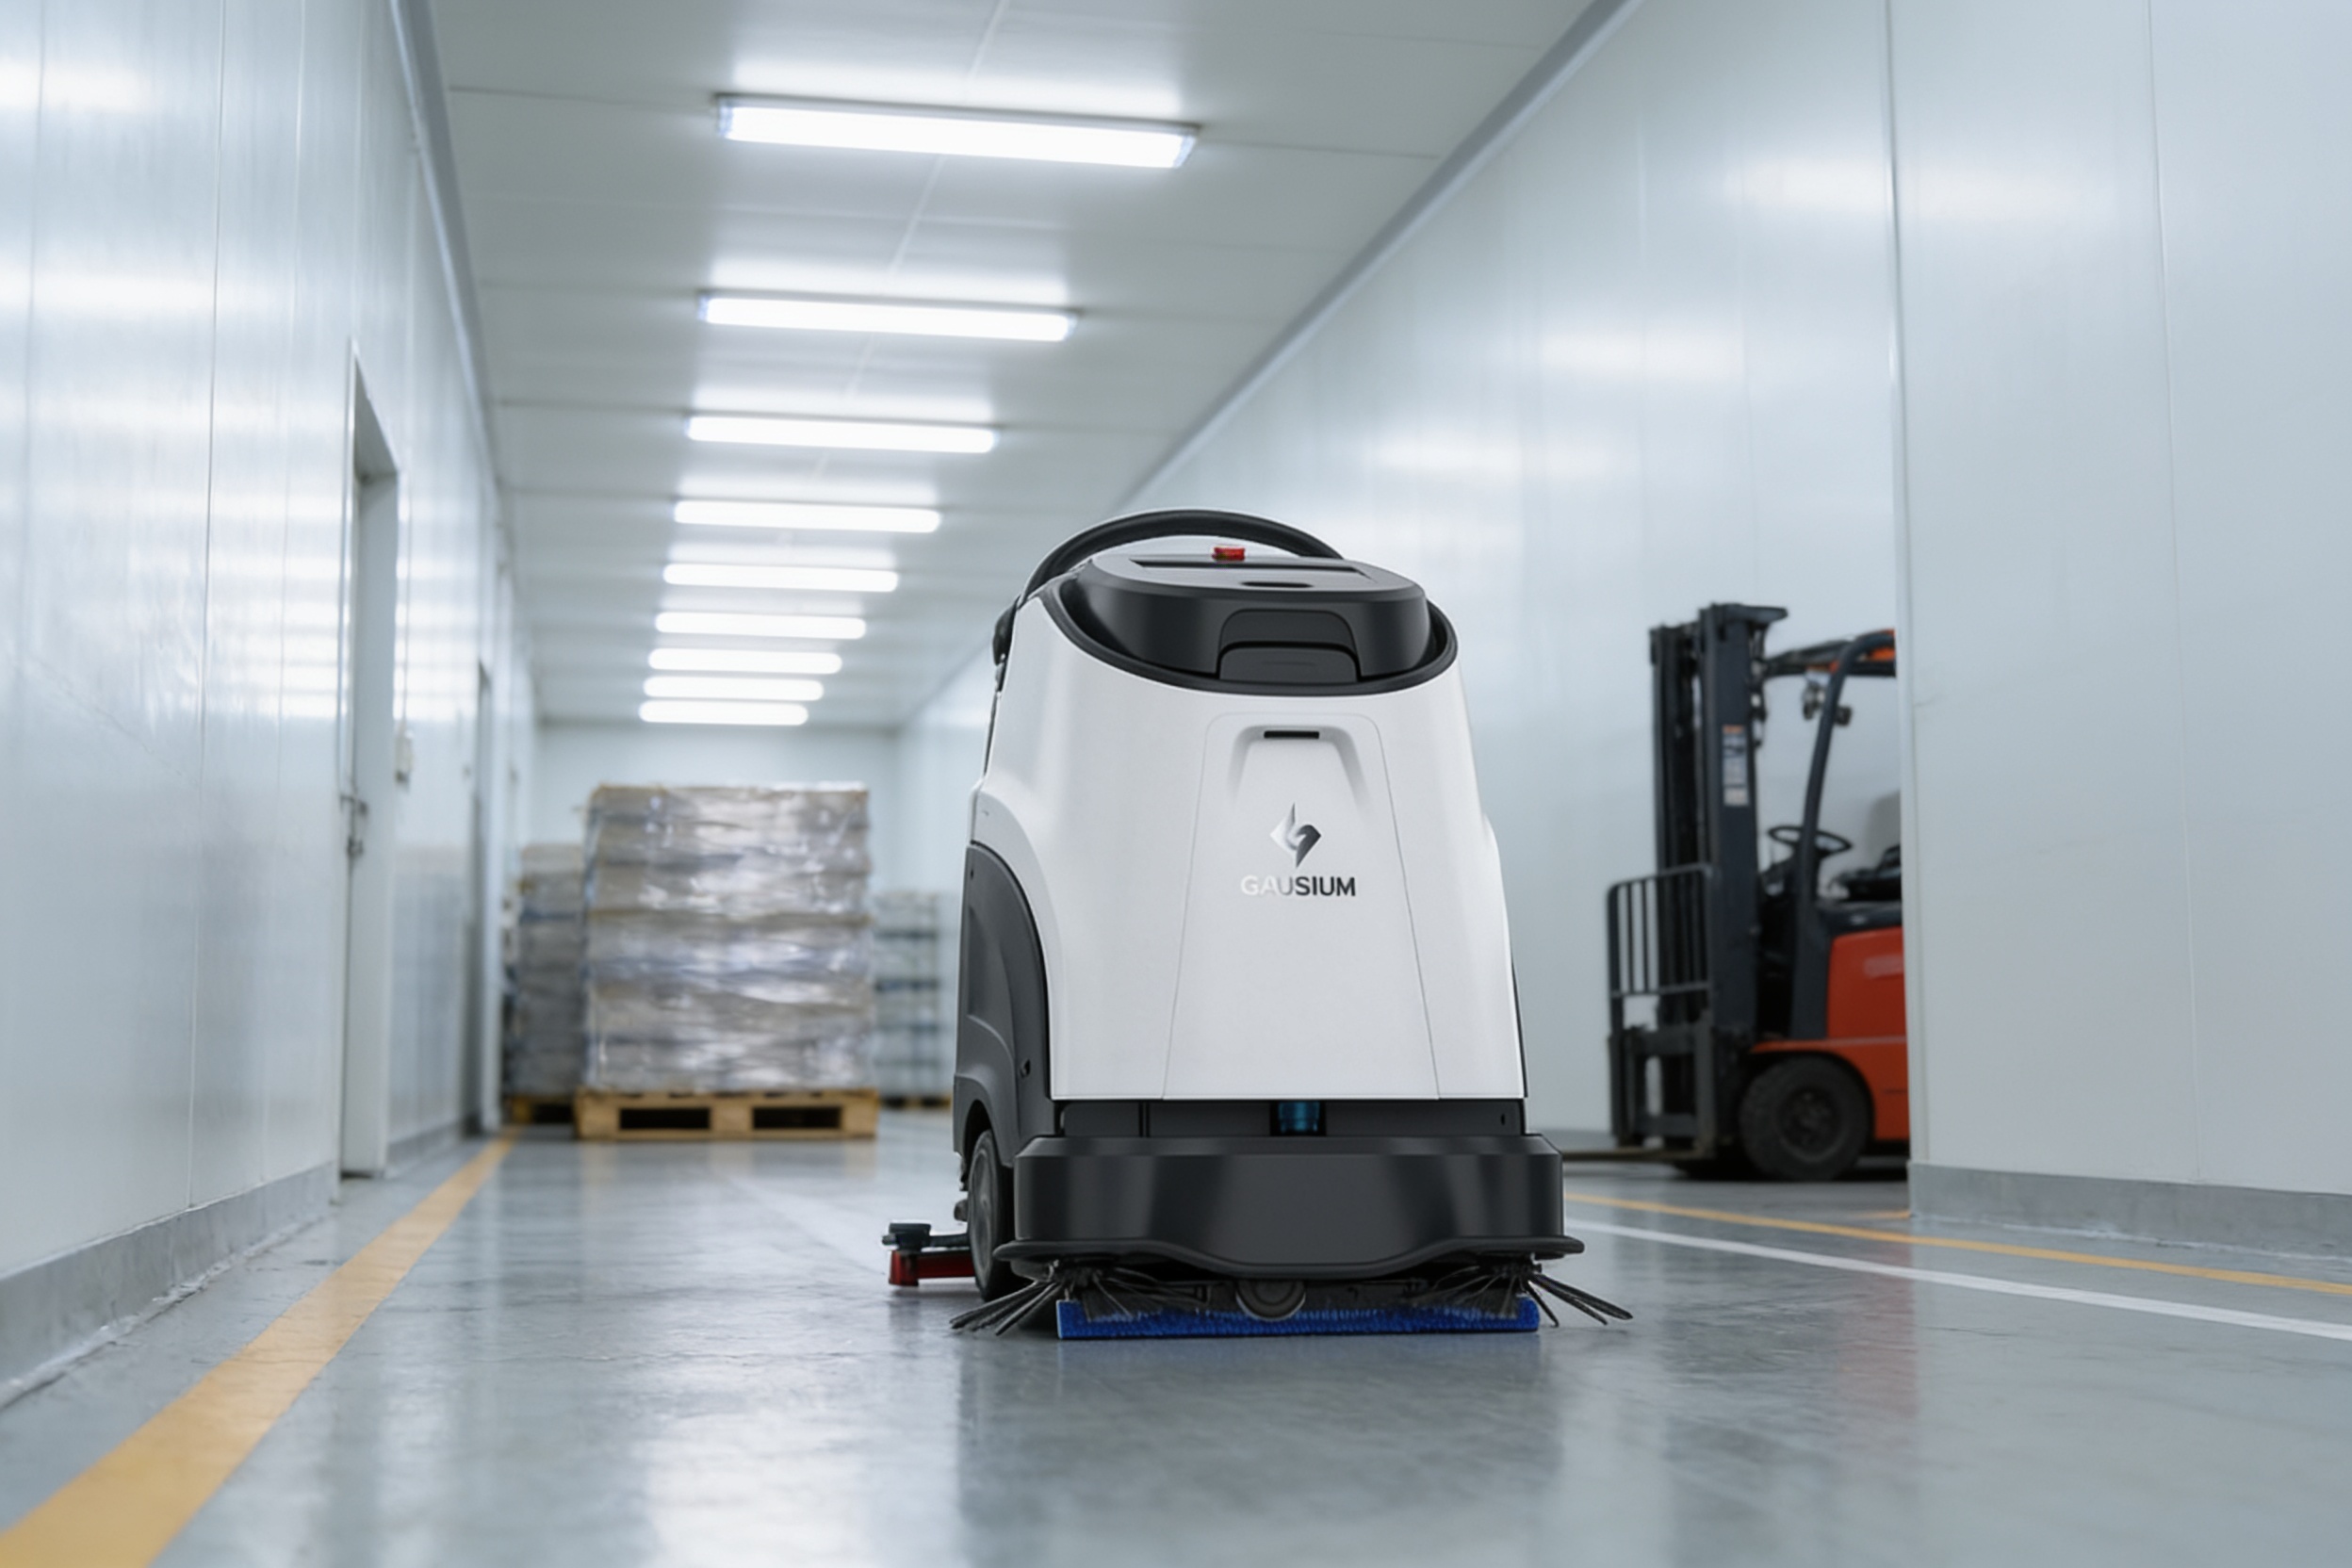
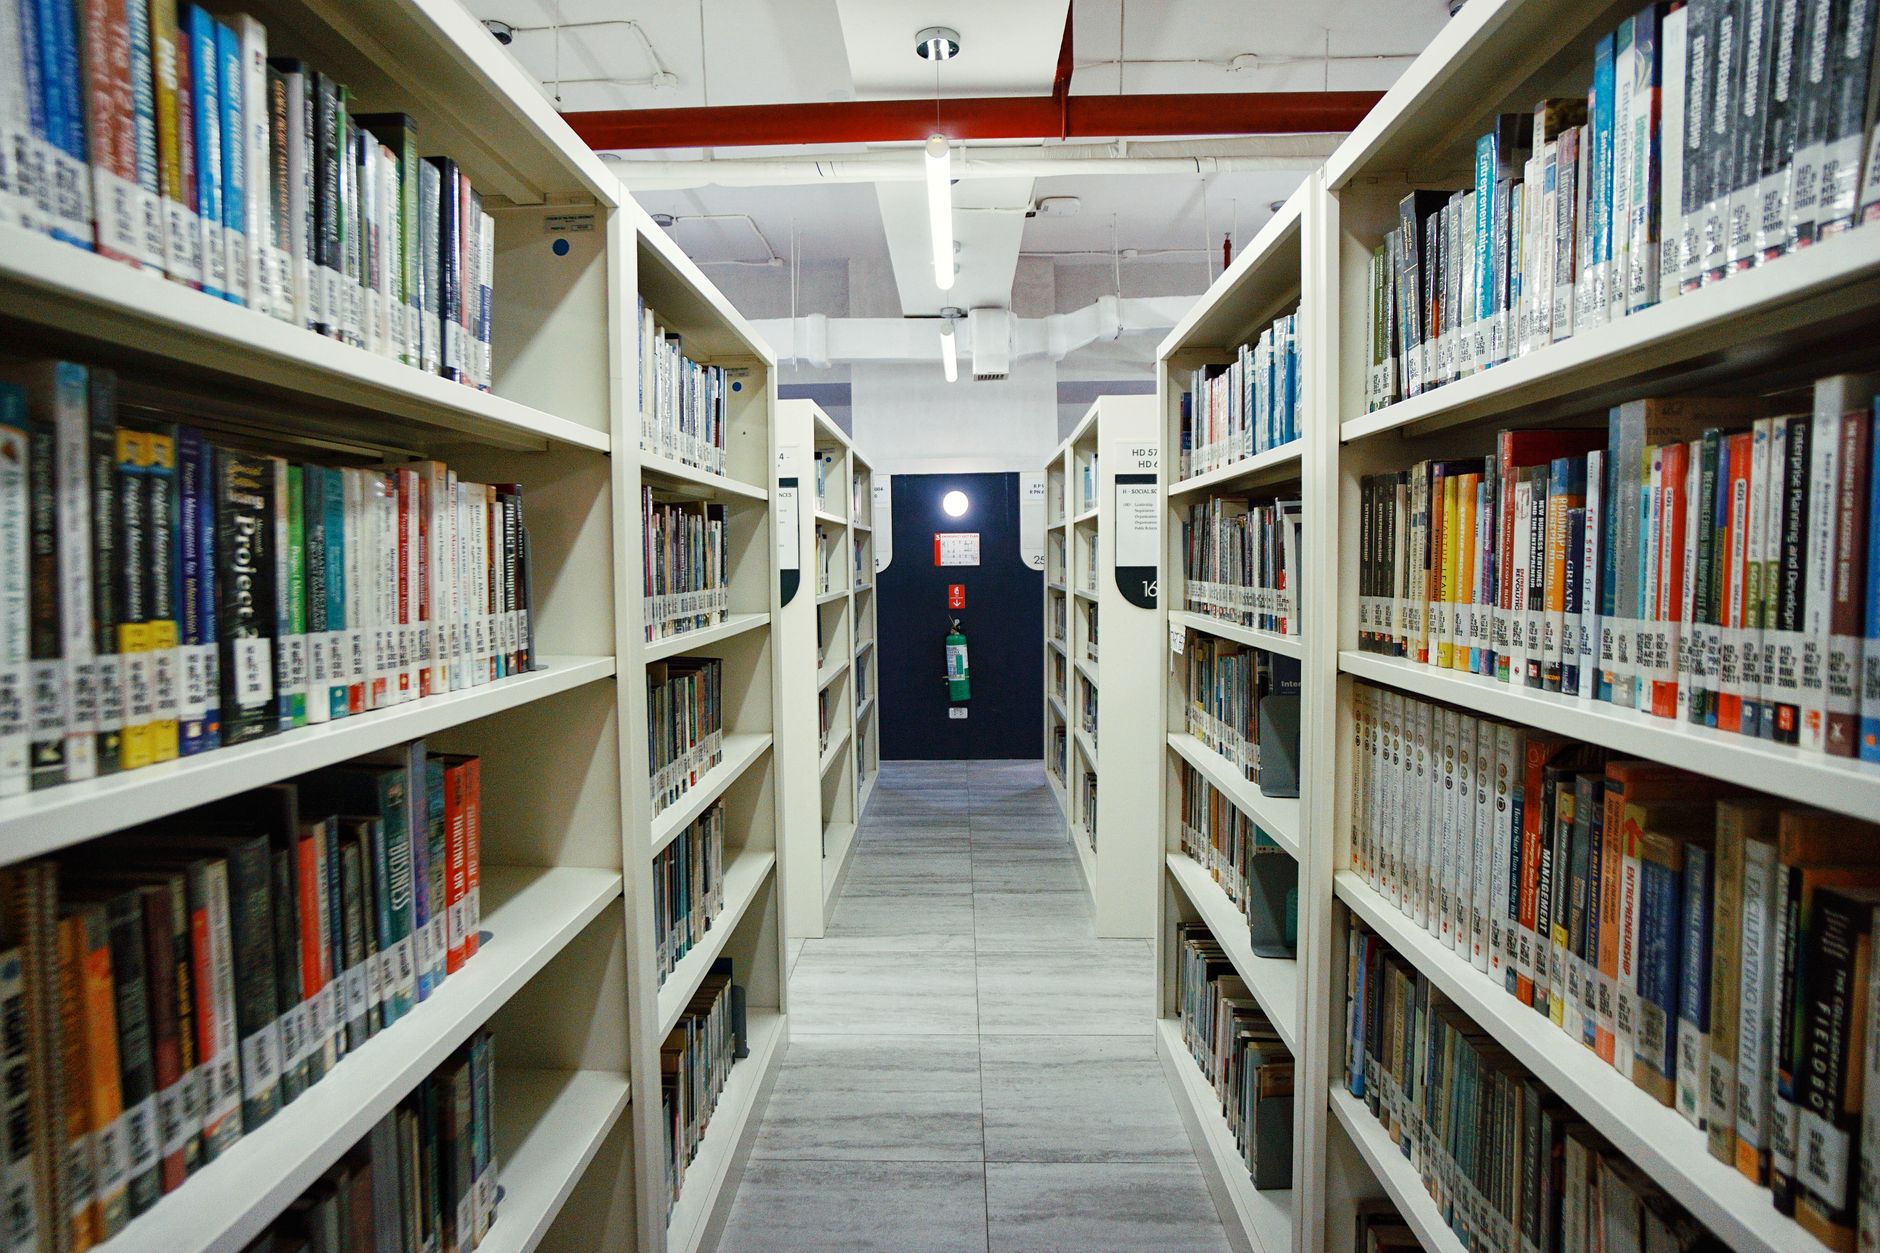
Floor scrubbing suits libraries for a simple reason. Reading rooms are large, open and mostly hard surfaces, and their aisles stay clear for long stretches. Those conditions let a robot run a planned route after closing, when no one is on the floor. Staff keep the tasks that need a person, such as shelving, patron help and cleaning around furniture.
This page covers where the savings come from, how the math works, what moves the number up or down, the risks to the return, and how a free site assessment turns a range into a quote.
How many public libraries could use a floor cleaning robot?
According to the IMLS FY 2019 Public Libraries Survey, 16,607 central and branch libraries and 671 bookmobiles provided service in FY 2019. IMLS treats that survey as a universe survey of all public libraries. The earlier IMLS FY 2011 preview reported 8,956 public libraries. The two figures differ because IMLS defines a public library as an administrative entity, while the FY 2019 count reports central and branch outlets.
Building size is the next question, and national data does not answer it directly. The Indiana State Library's 2022 facilities table covers 236 libraries and reports a mean central building of 27,291 square feet and a median of 8,810 square feet. The median sits far below the mean, so a few very large buildings pull the average up. Plan around the building you have, not the average.
Fit depends on the floor plan. A large central library with open reading rooms is a strong candidate. A small branch with many corners, small rooms and heavy furniture is a weaker one, and it may need a site assessment before any lease decision.
Median hourly wage, Janitors and Building Cleaners
$4,041
Monthly cost of one full-time worker, at the median wage plus payroll costs (an estimate, not a quote).
Where does the return come from in a library?
The main source of return is labor hours on the floor. Floor cleaning in a library is janitors and building cleaners work, and the government wage data on this page gives the local wage for that job. Each hour of scrubbing that moves from a staffed shift to an unattended overnight run is an hour the library no longer needs from staff during open hours.
The people who mainly work a library are librarians and library staff, and the robot does not take over their work. It takes over the janitors and building cleaners type of floor work. IMLS reported in its FY 2011 preview that librarians were about one-third of total staff, and that full-time equivalent counts had declined, so staff left for patron work are often stretched.
The return is strongest where the work is steady and predictable. A scrubbing route that runs the same way each night is easy to schedule and easy to measure. Where cleaning is contracted out, the return shows up as fewer contracted floor hours, which the site assessment can model.
How does the savings math work?
The calculator on this page works in three steps. First it takes the floor hours your crew spends on scrubbing and sweeping today, measured from shift logs or the site assessment. Second it applies the share of that work a robot realistically takes over, which is less than all of it, because a person still handles spills, edges, furniture and exceptions. Third it compares the labor hours saved with the lease cost of the equipment.
The savings range is the result of that comparison, shown next to this text. It is a range because each input is a range. Hours depend on floor area and layout, the share depends on how clear the aisles stay and how often furniture moves, and the lease cost is quoted after the site assessment, along with the fixed robot lease payment for the term you choose.
We lease robots through financing, then deploy and integrate them, train your staff and service them nationwide. The lease cost and the service terms arrive together in one quote, so the savings math has a fixed cost on the other side, which keeps the return easy to check.
| Task | Today | With a robot |
|---|---|---|
| Scrub open reading room floors | crew time logged for this task each night | run by the robot on a fixed overnight route |
| Sweep and scrub the entry vestibule | staff pass before opening or after closing | robot runs before opening, staff spot clean edges only |
| Clean aisles between stacks | crew time working around shelving and carts | robot covers clear aisles after staff park the carts |
| Check for spills and obstacles | walk-through during the shift | short check at open and close, plus flagged spots |
| Set up routes and update the map | not part of the work today | setup at start, updates whenever the layout changes |
The research behind this page did not find published hour figures for this setting. The hours in your own table come from your shift logs and the site assessment, which measures floor area and crew time.
What changes the number up or down?
A few factors move the range more than others. Check them before you treat the savings range as a planning number, since each one can push the result up or down.
The baseline matters most. A guessed crew-hours figure moves the range more than any choice of equipment, so build it from shift logs. Floor area and clear aisles come next, followed by how often furniture is moved and how much of the floor is carpet.
What do staffing and turnover mean for floor hours?

The BLS Occupational Outlook Handbook reports about 2,447,700 janitor and building cleaner jobs in 2024. It projects 2 percent growth from 2024 to 2034, about 47,800 net new jobs, and about 351,300 openings a year on average, mostly replacements. Services to buildings and dwellings is the largest employer, at 35 percent, so this work is spread across many kinds of buildings.
Turnover estimates are less settled. A janitorial vendor blog says annual separation rates for janitorial and cleaning roles commonly exceed 50 percent, with many contract cleaners at 100 percent or higher. That is a vendor source, not a government series, so read it as a sign of churn rather than a measured rate. The replacement load in the BLS openings figure points the same way.
We did not find a verified national count of the people who do this work at one library, so the calculator asks for your own headcount instead of assuming one. For most managers, filling floor hours is an ongoing task, and that is the practical reason the question comes up.
Are other buildings already using floor cleaning robots?
Adoption is still early, and the most detailed evidence is older than most managers would like. An AACEM and ISSA autonomous cleaning survey, sent to nearly 23,000 building service contractors, in-house providers and facility managers, found that 62 percent of contractors, 68 percent of in-house providers and 69 percent of facility or property managers had not used autonomous cleaning equipment. The full report is limited to members, and the survey dates to about 2019 or 2020.
A 2020 cleaning industry survey reported by CMM found that 10 percent of building service contractors used autonomous or robotic equipment, up 1 point from the prior year. Taken together, the two surveys describe a market where most organizations have not tried the equipment yet. A library that tests it is early, so it will have fewer peer references to call.
No dedicated 2025 or 2026 adoption survey turned up in this research. Check any claim about recent adoption against newer data before it goes into a board memo.
What are the risks to the return, and how do you avoid them?
The biggest risk is an overstated baseline. If the hours behind the calculation come from a guess rather than shift logs, the savings will not match what the building shows after go live. Measure actual crew time on each floor task across several typical weeks, and compare the result with the range once the robot has run through a full cycle of service.
The second risk is a layout that keeps changing. A library that rearranges furniture often will spend staff time on remapping and checks, and the return falls. Agree before go live on who updates the map, who checks the route before each run, and what staff do when the robot stops in an aisle at night.
The third risk is that the floor work itself does not go away, and that is why it is worth shifting. The BLS injury snapshot for janitors and cleaners, except maids and housekeeping cleaners, reports an incidence rate of 157.4 per 10,000 full-time workers in 2019 and 191.6 in 2020, with 21,100 nonfatal cases involving days away from work in 2020. A 2024 janitor-specific rate was not retrieved, so those figures are the most specific ones available here.
How long does it take to reach payback?
A realistic path starts with a free site assessment. We map the floor, measure open area and aisles, record crew hours with you, and model the savings range against a lease quote. The assessment does not commit the library to anything.
After the assessment comes setup. Routes are built on the mapped floor, staff are trained on checks and stop procedures, and the robot runs under supervision before it runs unattended. Go-live support covers the first nights, when doors, routes and sensors are most likely to need adjusting. The schedule depends on the building and any approvals the library needs, so it is set in the quote rather than promised here.
Payback comes when the labor hours saved, net of time staff spend on setup and checks, cover the lease cost over the term. Large open floors, short setup and steady hours reach that point sooner than many small rooms with frequent layout changes. Expect the payback point to be a range too.
To get a precise figure, request the free site assessment with your floor plan, your shift schedule for cleaning, and an estimate of open hard-floor area. The visit returns a site-specific range and a lease quote you can compare against your budget.
Frequently asked questions
Want a cleaning robot at your public library?
Tell us about your site. We will recommend the robot, quote the lease, and keep it serviced.
Sources
- US Bureau of Labor Statistics, Occupational Employment and Wage Statistics (OEWS May 2024)
- IMLS FY 2019 Public Libraries Survey results
- IMLS FY 2011 Public Libraries Survey preview
- Indiana State Library 2022 library facilities table
- BLS Occupational Outlook Handbook, janitors and building cleaners
- BLS injury snapshot, janitors and cleaners except maids and housekeeping cleaners
- ISSA and AACEM autonomous cleaning survey report
- CMM 2020 cleaning industry technology survey
- Janitorial turnover vendor blog