
The short answer
Cleaning robot ROI for ice rinks comes mainly from taking the janitor-type floor work on concourses, lobbies and locker room corridors off the schedule between sessions, so ice and guest staff stay on the ice and in front of guests. The savings range depends on how many hours of that work the robot takes over, how much of the route it realistically completes, and the lease payment quoted after a site assessment. Use the calculator on this page for a starting range, then confirm it on site.
Key takeaways
- The return comes from floor hours between sessions, not from the ice itself.
- Savings depend on the hours the robot takes over and the share of the route it completes.
- Event calendars and gaps between sessions move the number more than building size does.
- The lease payment is quoted after a site assessment, so the savings range stays a range until then.
- Measure your floor hours before you trust any payback estimate.
Run the numbers for your site
Pick your city or state for a real regional number - we use the real BLS wage there. (On the live site this auto-detects from your location.)
What do you want to automate?
The robot runs the open floor overnight; your crew keeps detail and edges.
What return can ice rinks expect from cleaning robot ROI?
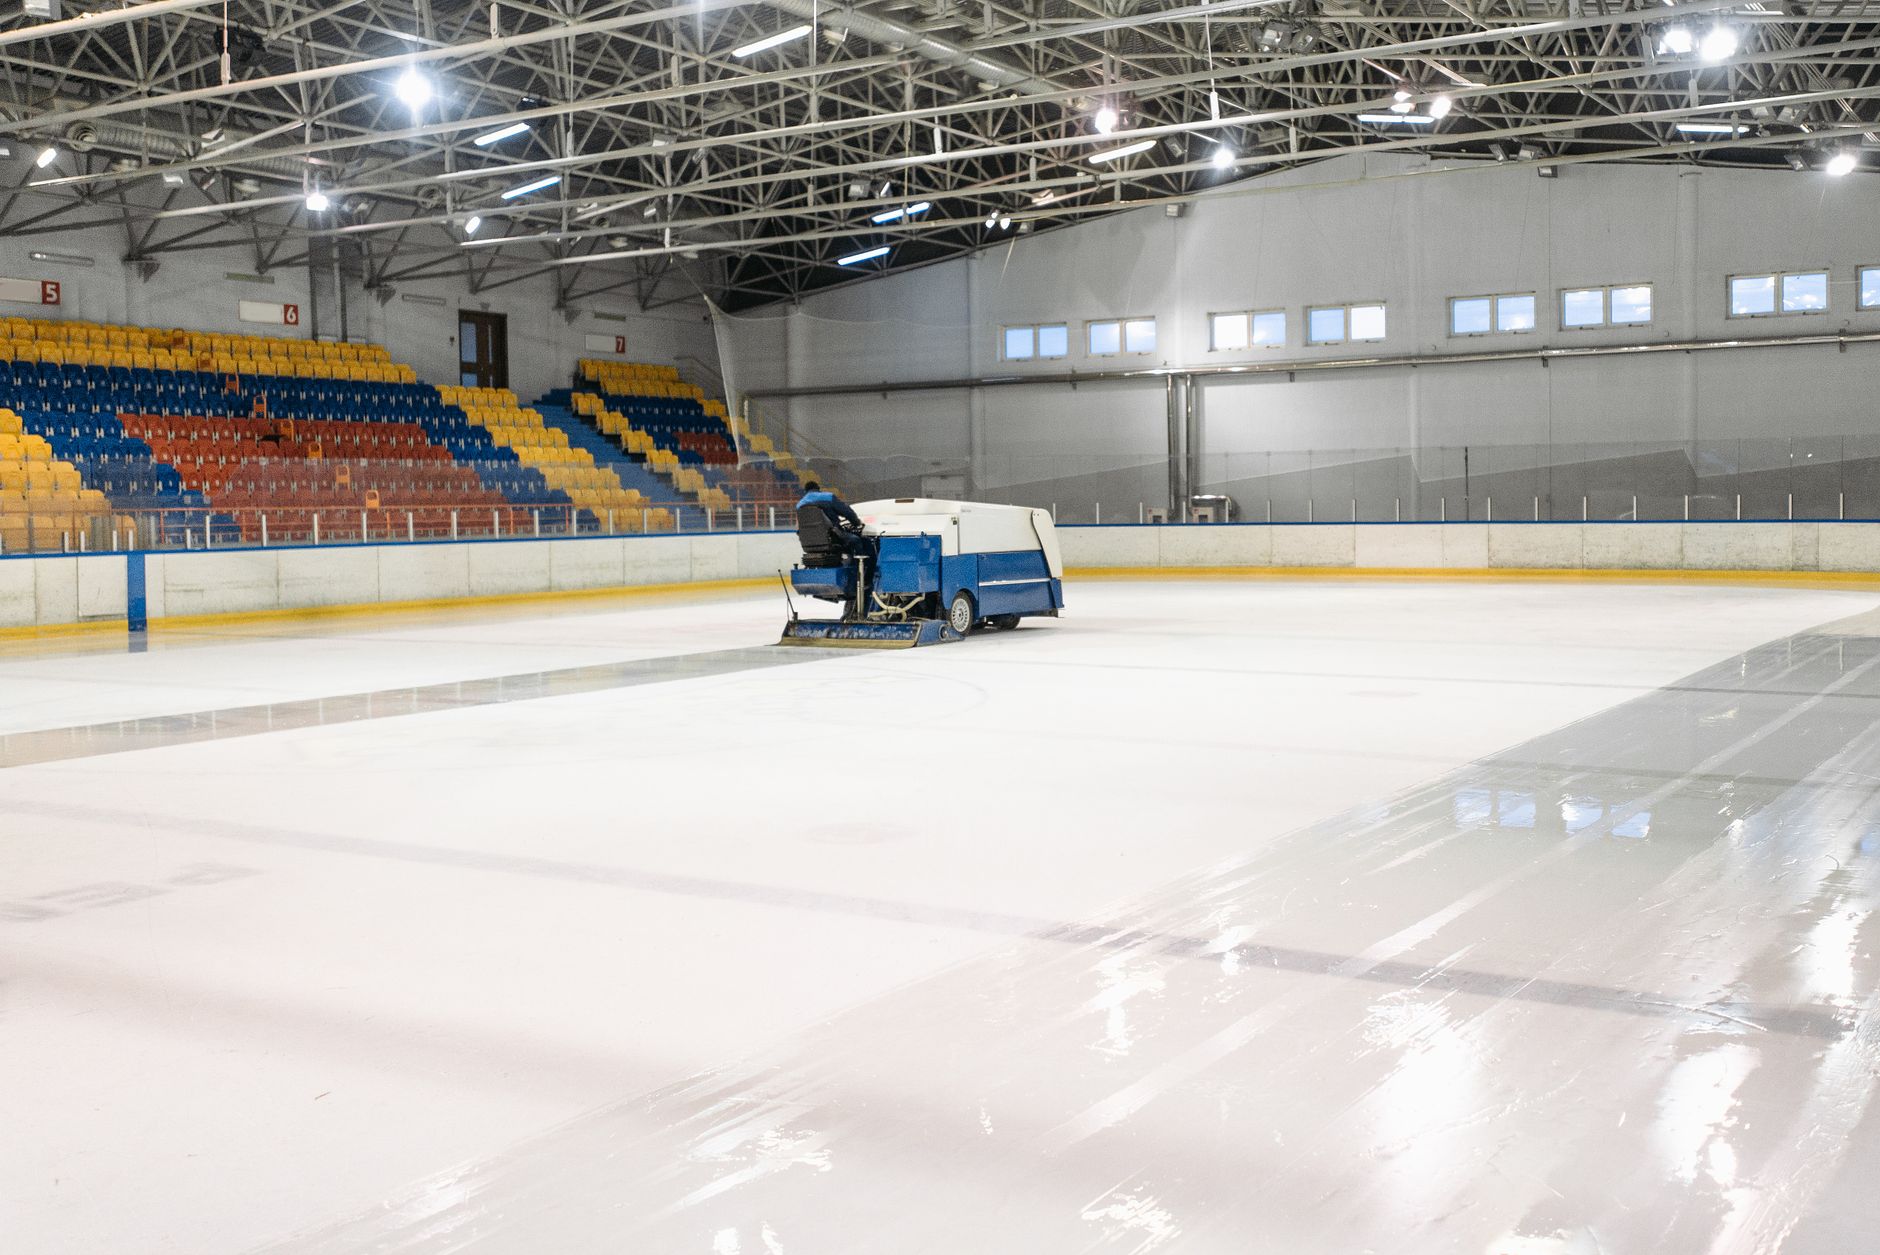
An ice rink's floor work splits into two groups. The ice surface, dasher boards and equipment belong to the ice crew. The concourses, lobbies, restroom corridors and locker room hallways belong to the cleaning crew, and they need heavy work between sessions and after events. Cleaning robot ROI for ice rinks comes from that second group of hours.
A realistic return is a range, not a single figure. It rises when a rink has short gaps between sessions and a large, flat floor, and it falls when most of the work needs hands for spills, restrooms and detail work. The calculator on this page gives a starting range from your inputs. That range is not a promise, and the lease payment is only final once it is quoted after a site assessment.
No two rinks have the same schedule, floor area or number of events. Read the range as a planning tool for the decision, and let the site assessment replace the planning numbers with measured ones.
Where does the return come from at an ice rink?
The return comes from the janitors and building cleaners type of work: sweeping, mopping, wet pickup and routine floor passes on hard surfaces. According to the Bureau of Labor Statistics, about 2,447,700 people held this job in 2024, and its Occupational Outlook Handbook projects 2 percent growth from 2024 to 2034, which is slower than average. Slow growth means the workforce will not expand quickly, so waiting for staffing to catch up is a weak plan for overnight coverage.
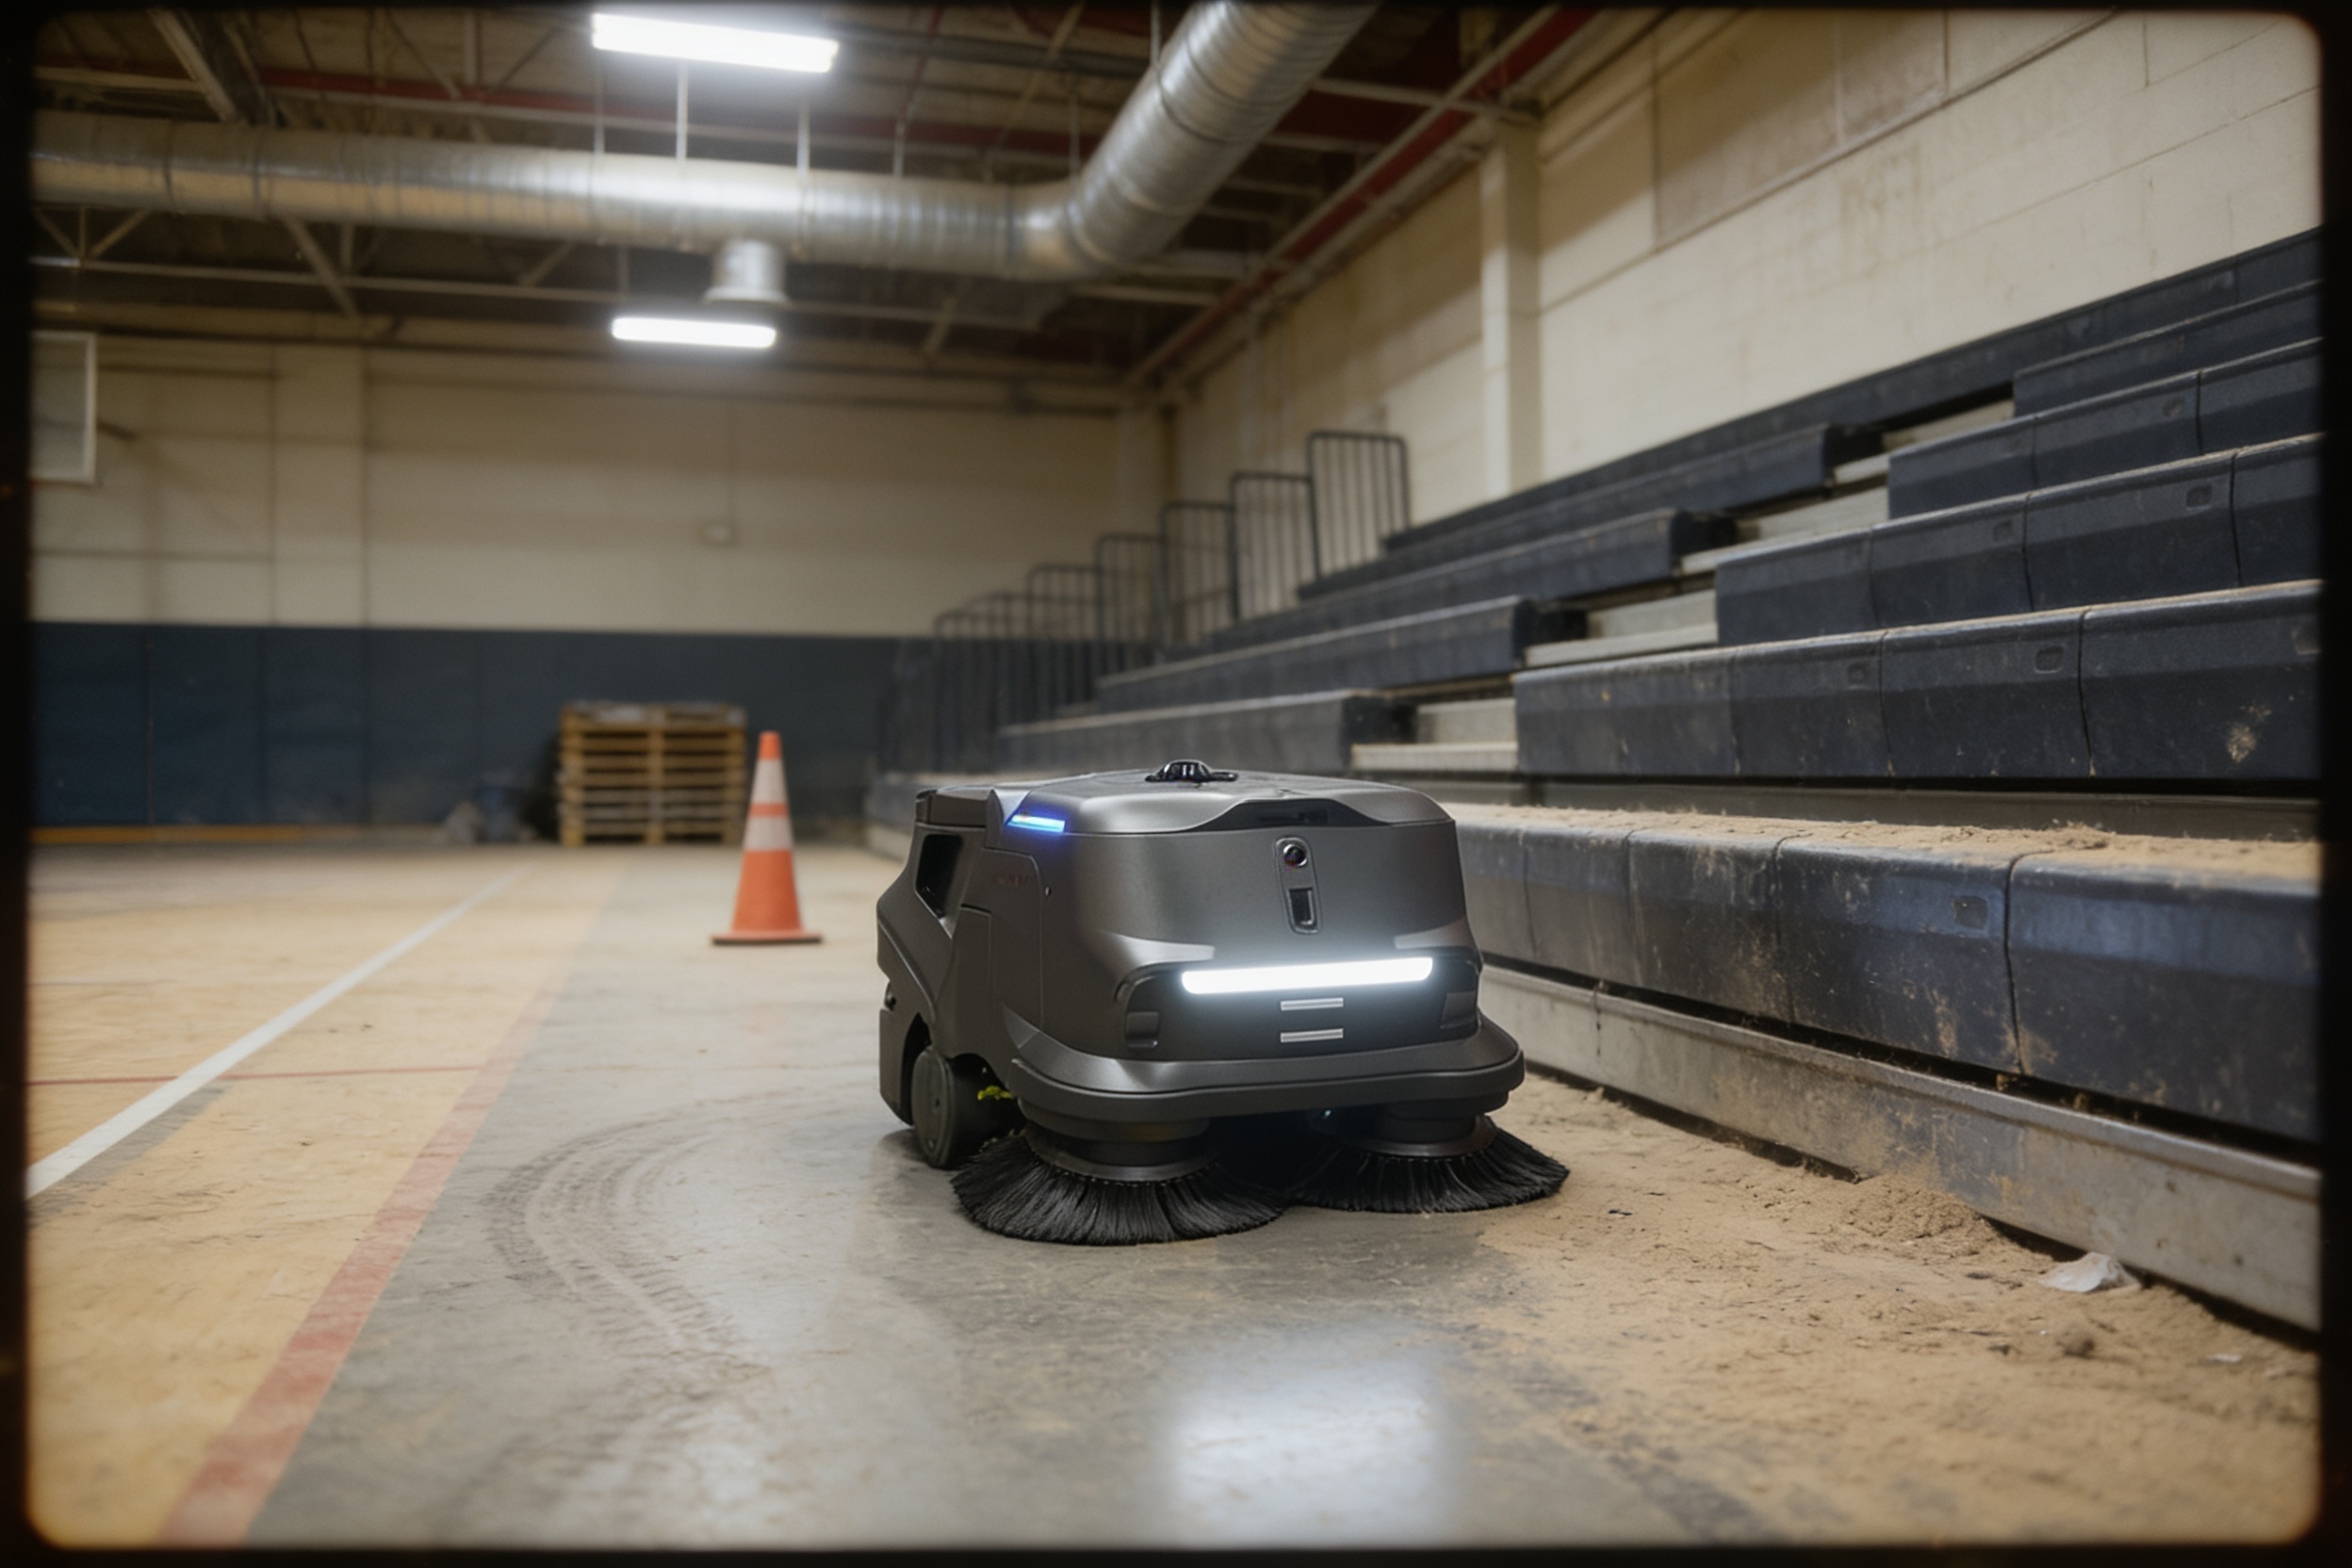
Location in the building matters more than building size. The concourse, lobby and locker room corridor loops are flat, repeatable and suited to scheduled passes. The ice surface itself is not on the route, and neither are boards, dasher work or any hot water or sharp debris cleanup.
The overlap is the part to check. Some hours that look like floor work are done by the same people who run the ice, and moving those hours is an operations decision, not a robot decision. Only the janitor-type hours count toward the savings range.
Median hourly wage, Janitors and Building Cleaners
$4,041
Monthly cost of one full-time worker, at the median wage plus payroll costs (an estimate, not a quote).
How many ice rinks are there, and is cleaning robot adoption growing?
No single authoritative recent count of US ice rinks was found. According to Statista, which cites the International Ice Hockey Federation for the 2022/23 season, the US had 2,606 ice hockey rinks, about 500 of them outdoor and the rest indoor. IBISWorld counts businesses rather than rinks, and its 2025 edition reports 477 ice rink businesses, up 1.9 percent from 2024. Those two numbers measure separate things, so do not add them together.
Adoption is growing worldwide. According to the International Federation of Robotics, as reported in World Robotics 2025 Service Robots, professional cleaning robots were the third-largest professional service robot segment in 2024. Their sales rose 34 percent to more than 25,000 units, and most of them clean floors. Total professional service robot sales were nearly 200,000 units, up 9 percent.
These are global figures, and the federation advises against comparing numbers across separate World Robotics reports. Use them to show the category is established, not to size the ice rink market.
How much cleaning labor does an ice rink schedule use?
Published staffing figures for rinks are thin, and most come from job postings and news reports rather than benchmarks. According to a WKAR report from January 2025, eight ice crew members work the ice each night for each varsity game at one university arena. That is the only recent crew count we found, and it covers ice work, so treat it as a reference point for game-night staffing and not as janitorial headcount.
Job postings show the shape of the overnight work. One arena's part-time overnight utility crew worked shifts of 4 to 8 hours covering ice and equipment removal and dressing room setup. A separate arena posting says its ice crew arrives 3 hours before each game. Postings show what employers ask for, not how long the work takes in practice.
The gap in the public record is the main finding. No published standard for crew size per night by rink type was found, and no source gives hours for concourse and lobby cleaning at a rink. The hours on this page are therefore set by the site assessment, which times the actual floor, the event calendar and the crew.
How is the savings range calculated?
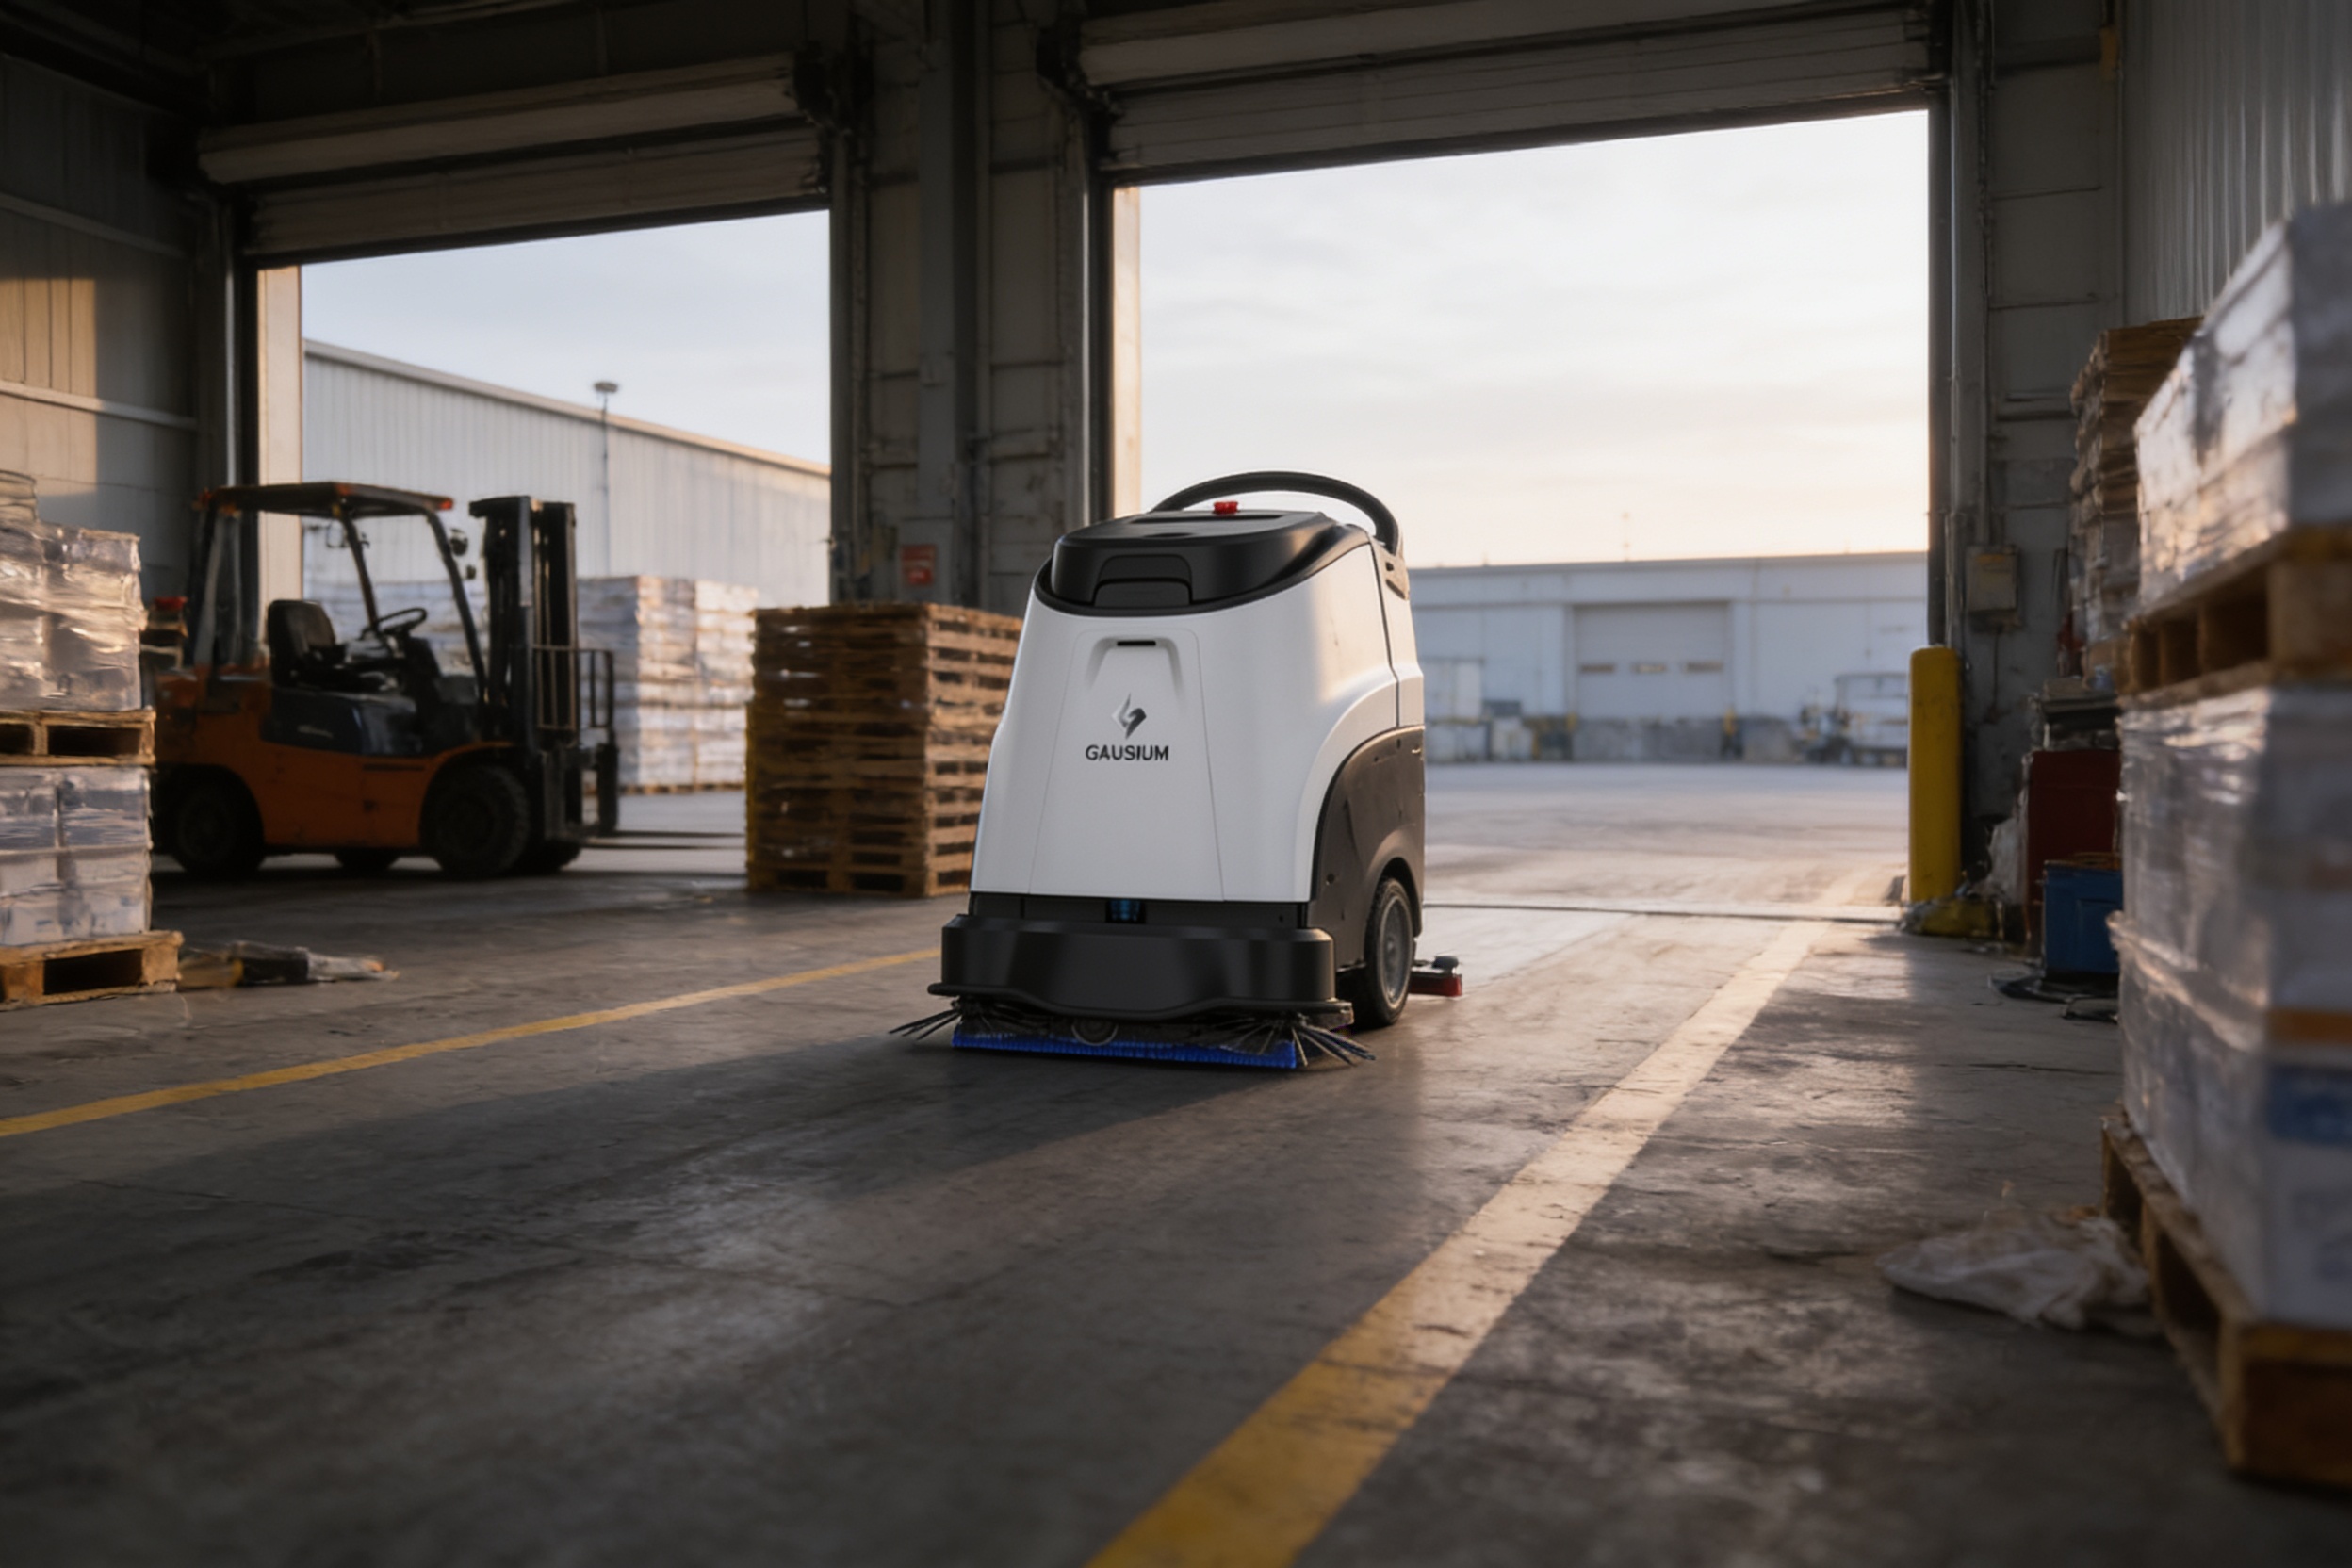
The calculation has three inputs. The first is the hours of janitor-type floor work on the routes the robot will run each week. The second is the share of those hours the robot realistically completes, since some passes still need a person for spills, restrooms and obstacles. The third is the fixed robot lease payment, which is quoted after a site assessment.
The labor side converts the hours taken over into money using the local wage for this job, which appears in the government wage data on this page. Only that janitor-type work counts. We do not price the time of ice crew, guest service staff or event staff, because the robot does not take their work off their plate.
Net value is the labor value of the hours taken over, minus the lease payment, plus any overtime or unfilled shift cost the rink avoids. The range comes from low and high assumptions for the share of work completed and the hours. If the share is low, the range narrows fast, which is why the assessment measures it on the actual floor.
What changes the number up or down?
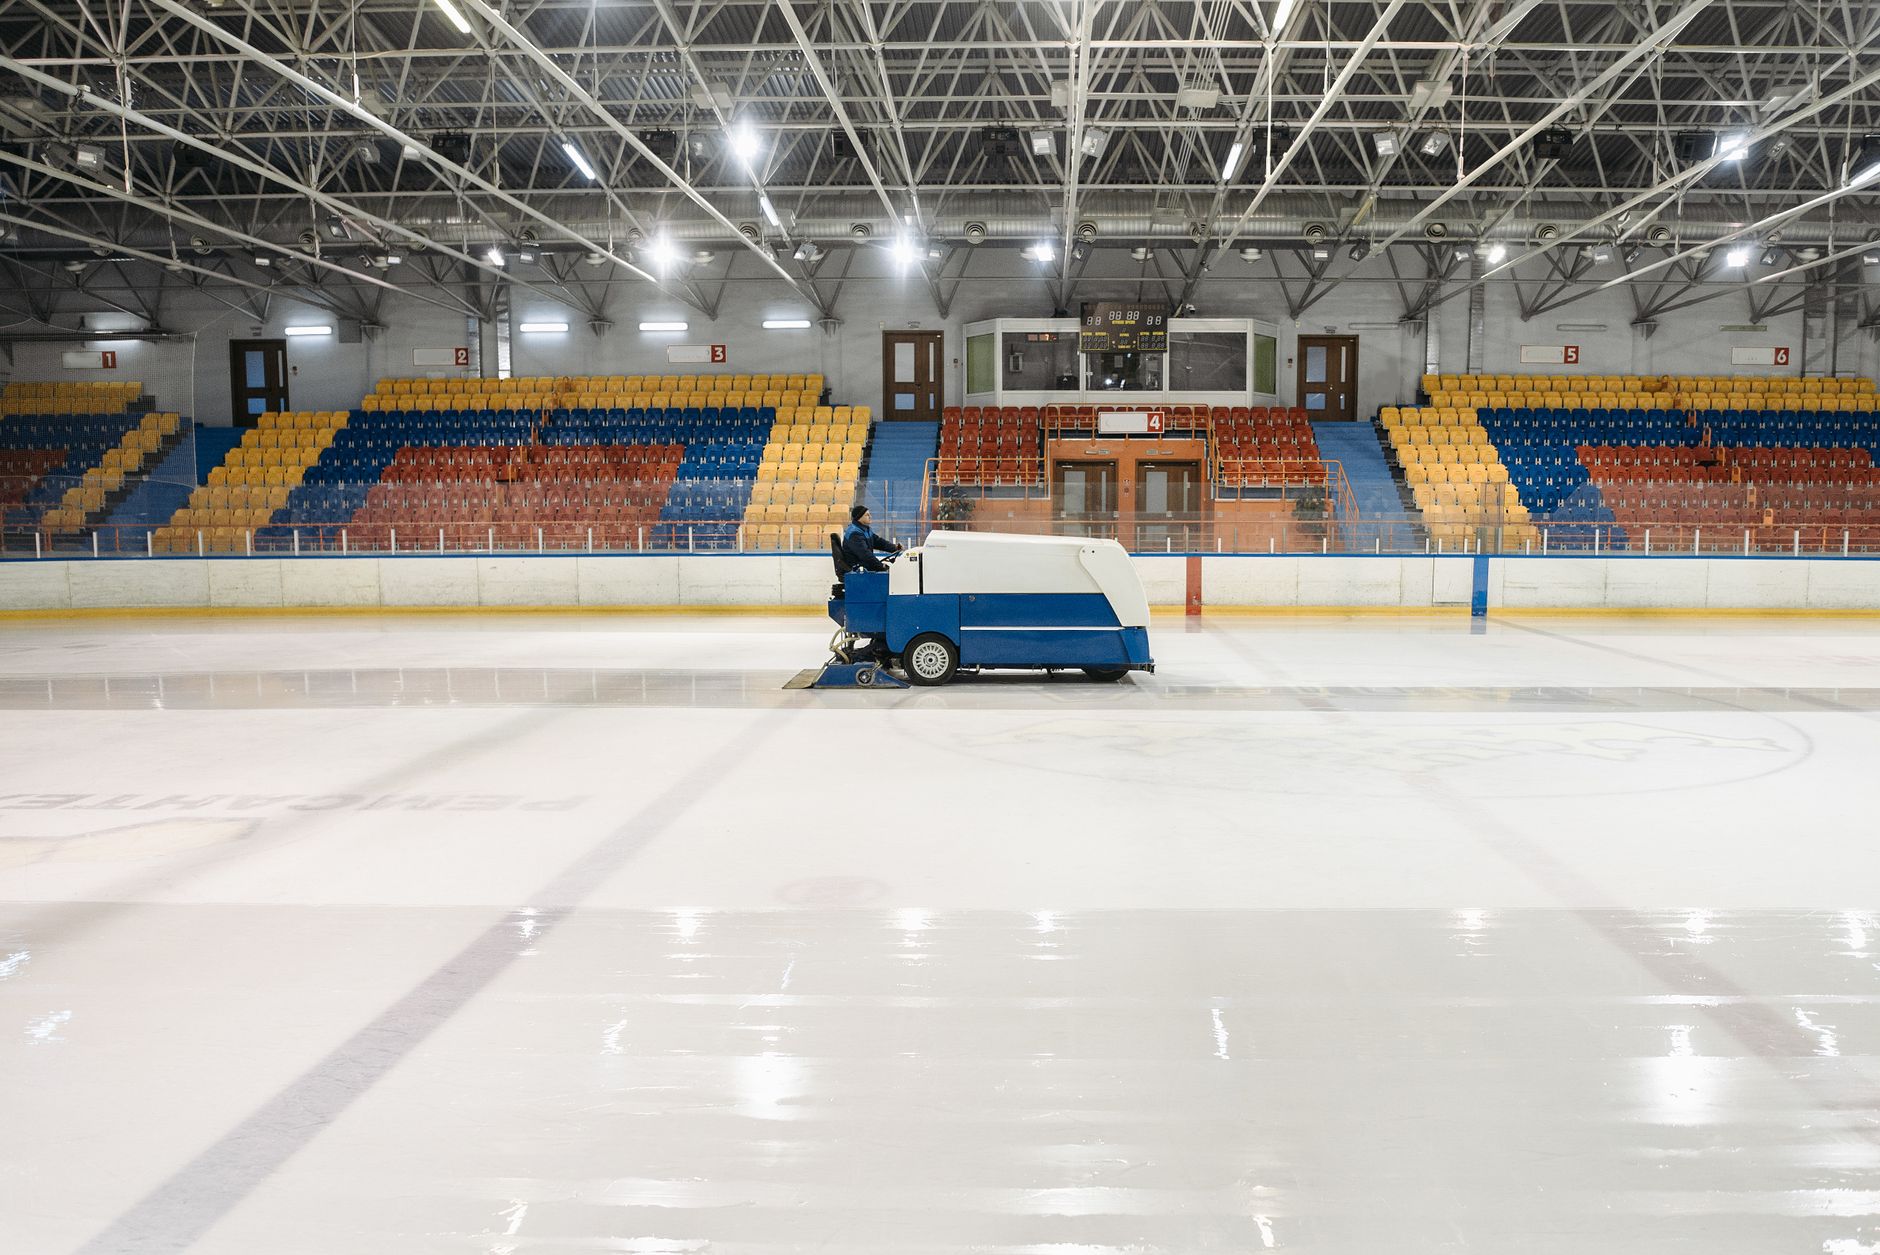
Four things move the range most: the length of the gaps between sessions, how much of the floor is flat and clear at changeover, how much water and slush reach the concourse, and how much of the work stays with people. Long gaps and a clear floor push the range toward the high end. Short gaps, heavy wet traffic and many restroom tasks push it lower.
The checklist below covers what to check before you decide. Each item has a known direction, and each one can be measured on a site visit rather than guessed at from a brochure.
What are the risks to the return, and how do you avoid them?
The main risk is overcounting hours. If the plan assumes the robot takes work it cannot do on your floor, the savings range drops and the lease becomes harder to justify. Measure the share of work completed during the site assessment, and start with the flattest, cleanest routes.
The second risk is downtime. A robot offline on a game night returns no hours and still leaves the floor to someone. Plan for a backup unit, a remote triage path and a person assigned to the route until the first sessions run clean.
The third risk is safety, and the government data needs careful reading. According to the Bureau of Labor Statistics, the rate of injury and illness cases for janitors and cleaners, excluding maids and housekeeping cleaners, rose from 137.1 per 10,000 full-time equivalent workers in 2019 to 157.4 in 2020. That rise is a reason to review which tasks people keep, especially wet pickup and heavy lifting. It does not show that a robot lowers the rate, so do not build the return on that claim.
The fourth risk is cutting staff before the robot is proven. If the crew shrinks early, coverage can slip before the robot has earned its place. Keep the existing crew until the first event cycles run clean.
How long until the robot pays back?
The timeline runs in stages: site assessment, route mapping, a supervised pilot on a few sessions, full go-live and then a review of measured hours against the range. Payback starts after go-live and arrives once the measured hours cover the lease payment. Because the range is built from measured hours, the payback date is only as firm as the assessment behind it.
A useful first review checks four things: whether the robot finished the planned route, how often a person had to step in, how many floor hours the crew actually saved, and whether event turnaround stayed on time. If all four hold, the payback estimate can be trusted. If one does not, adjust the route or the staffing before adjusting the number.
How do you get a precise figure for your rink?
Start with the calculator on this page, which is pre-filled for ice rinks, and then book a free site assessment. We pick the right robot for the site, lease it through financing, deploy and integrate it, train the staff and service it nationwide. During the assessment we map the concourse, lobby and locker room routes and measure the floor hours and the share of work the robot can take.
The output is a quote for the fixed robot lease payment and a savings range built from your measured hours, not from national averages. Ask for the assumptions in writing, including the share of work completed, the crew coverage plan and the service terms. That gives your sign-off a number you can check against the floor.
Frequently asked questions
Want a cleaning robot at your ice rink?
Tell us about your site. We will recommend the robot, quote the lease, and keep it serviced.
Sources
- US Bureau of Labor Statistics, Occupational Employment and Wage Statistics (OEWS May 2024)
- BLS Occupational Outlook Handbook, Janitors and Building Cleaners
- BLS Survey of Occupational Injuries and Illnesses snapshot, Janitors and Cleaners
- Statista, Number of ice hockey rinks in the United States
- IBISWorld, Ice Rinks in the US (NAICS 5347)
- RoboticsTomorrow, IFR World Robotics 2025 Service Robots
- WKAR news report on university arena ice crew, January 2025
- Teamwork Online job posting, overnight utility crew member
- Monster job posting, part-time ice crew, Tempe, AZ