
The short answer
The cleaning robot ROI for movie theaters comes mostly from floor scrubbing that a crew would otherwise do in the gaps between showings, in lobbies, concession queues and the main concourse. The savings range depends on how many of those hours the robot realistically takes over, whether the freed hours actually leave the schedule, and the lease cost quoted after a free site assessment. Treat any figure as a range until a site assessment measures your floor.
Key takeaways
- The return comes from floor hours in the gaps between showings, not from replacing ticket or concession staff.
- Savings only count when reassigned or unfilled hours actually leave the schedule.
- The robot takes janitors and building cleaners type of work, so the government wage data on this page sets the labor side.
- Rated scrubber coverage overstates real coverage in busy lobbies, so plan on a pilot route.
- A precise figure comes from a free site assessment, and the lease payment is quoted after it.
Run the numbers for your site
Pick your city or state for a real regional number - we use the real BLS wage there. (On the live site this auto-detects from your location.)
What do you want to automate?
The robot runs the open floor overnight; your crew keeps detail and edges.
What is the cleaning robot ROI for movie theaters?
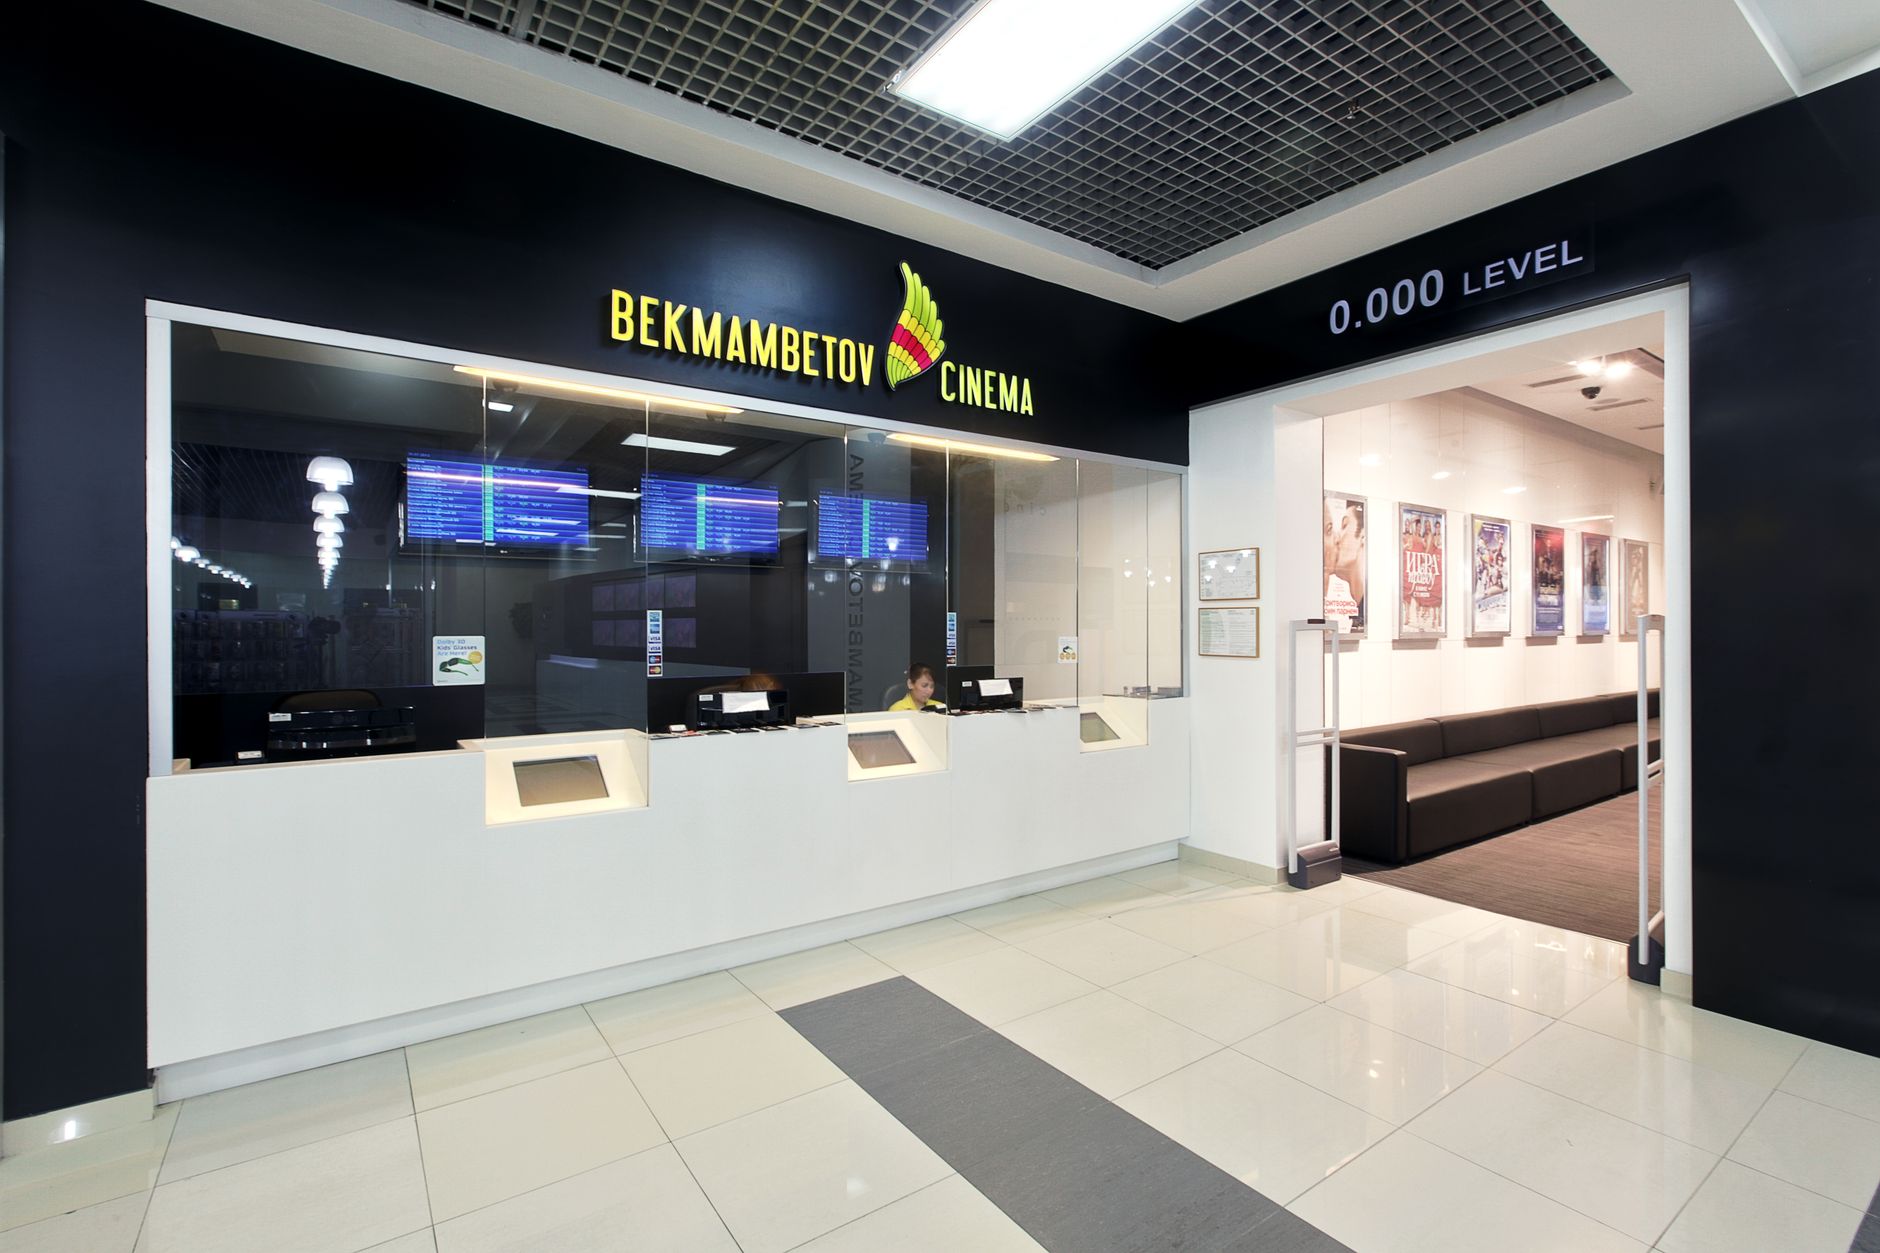
A cleaning robot ROI for movie theaters compares the floor labor the robot takes over with the lease cost of the robot for the same period. In a theater that work is mostly scrubbing and sweeping in lobbies, concession lines and the main concourse, done in the gaps between showings. The return therefore depends on how many floor hours a crew spends in those gaps, and how many of those hours a machine can take without a person walking behind it.
Savings are shown as a range, never a promise. The range starts from the hours in your site plan, the share of those hours a robot realistically handles, and the lease cost quoted after a site assessment. No single figure fits every theater. A multiplex with wide open lobbies and a small house with narrow aisles have very different floor work, and the same robot will take a different share of each.
The government wage data on this page gives the local wage for the janitors and building cleaners type of work the robot takes over. That wage is the labor side of the math. The robot does not replace ushers, concession workers or guest service staff, and this page does not price their time.
How big is the US movie theater floor base?
The theater owners trade association, which rebranded in March 2025, represents more than 32,000 movie screens in the US, according to trade coverage of that rebrand. Screens track floor area better than a theater count does, because each screen adds a house, a share of a concession area and a share of the shared lobby. A verified count of movie theater sites was not found for this page, so the scale here is counted in screens.
The number that matters on any one site is not the national total. It is how many houses share one lobby and concourse, and how long the gaps are between showings. A house that runs many short gaps has less time for a full crew pass, and that is where a machine working through the gap adds the most value.
Floor traffic also rises on heavy release days and event screenings, when the same lobby takes more foot traffic in a shorter window. Plan the route and the gap length for the busiest day of the week, not the average day.
Median hourly wage, Janitors and Building Cleaners
$4,041
Monthly cost of one full-time worker, at the median wage plus payroll costs (an estimate, not a quote).
Who does the floor work in a movie theater today?
Floor work is usually handled by the same people who run concessions, seat guests and check tickets, so cleaning is one task on a long list. The staffing data in the research for this page is dated. A Los Angeles City Clerk document from 2015 reported that 90 to 95 percent of motion picture theater staff are part-time, with annual turnover of 100 to 200 percent.
Older staffing counts help with scale, though they are not a recent roster. A 1933 Census of American Business table put average employees at 6.9 per motion picture-only theater, and a 1931 BLS study of eleven Washington, D.C. neighborhood theaters found 10.7. No recent BLS or Census per-theater headcount was verified, so the typical headcount on this page is a rounded planning figure of 7 from the 1933 Census. Your site assessment should replace it with the actual roster.
High turnover and part-time shifts mean the same floor route gets handed to a new person every few months. A set robot route keeps the order of the lobby, so consistency is a return driver in its own right, not only an hour count. Replacement demand for this kind of work is also large. According to the Bureau of Labor Statistics Occupational Outlook Handbook, about 351,300 openings a year are projected for janitors and building cleaners over 2024 to 2034, including replacement needs, while employment growth is projected at 2 percent, slower than average. The zones below show where the route runs.
How does the cleaning robot ROI math work?
The math has three parts. The first is the hours a crew spends on floor scrubbing and sweeping between showings. The second is the share of those hours a robot realistically takes over. The third is the lease cost for the robot over the term you choose, quoted after a site assessment. The labor offset is those robot-covered hours valued at the local wage for the janitors and building cleaners type of work, shown in the government wage data on this page, set against the lease cost for the same period.
The robot share matters most. A robot rarely takes the whole job. It covers open floor on a set route, while staff handle spill response, edges, fixtures and any area the route cannot reach. Treat the share as the figure to test in a pilot, not as a fixed fraction. The calculator on this page starts from floor type and gap length, then shows a range rather than one number.
Hours that stay on the schedule do not count. If a crew member still walks the same route after the robot runs it, the offset is zero. A realistic return comes from reassigning those hours or covering shifts that go unfilled, not from assuming the job disappears on the first day.
| Task | Today | With a robot |
|---|---|---|
| Scrub the main concourse between showings | Crew pass on a set schedule | Robot runs the open route, staff check the edges |
| Scrub the lobby before doors open | Full manual pass by a crew member | Robot runs open floor, staff do spot cleaning |
| Respond to spills at the concession queue | Staff stop work to clean up | Staff still respond, robot runs the route after |
| Sweep and scrub hard corridors to restrooms | Manual pass for much of the shift | Robot covers straight runs, staff handle fixtures |
| Route setup and daily check | Not needed for manual passes | Map set once, daily route check before opening |
The research for this page did not verify hour counts for theater floor work, so the rows describe how the task splits rather than a number of hours. The site assessment measures actual hours per gap and per shift to fill in the figures.
How much floor can a cleaning robot cover in a theater?
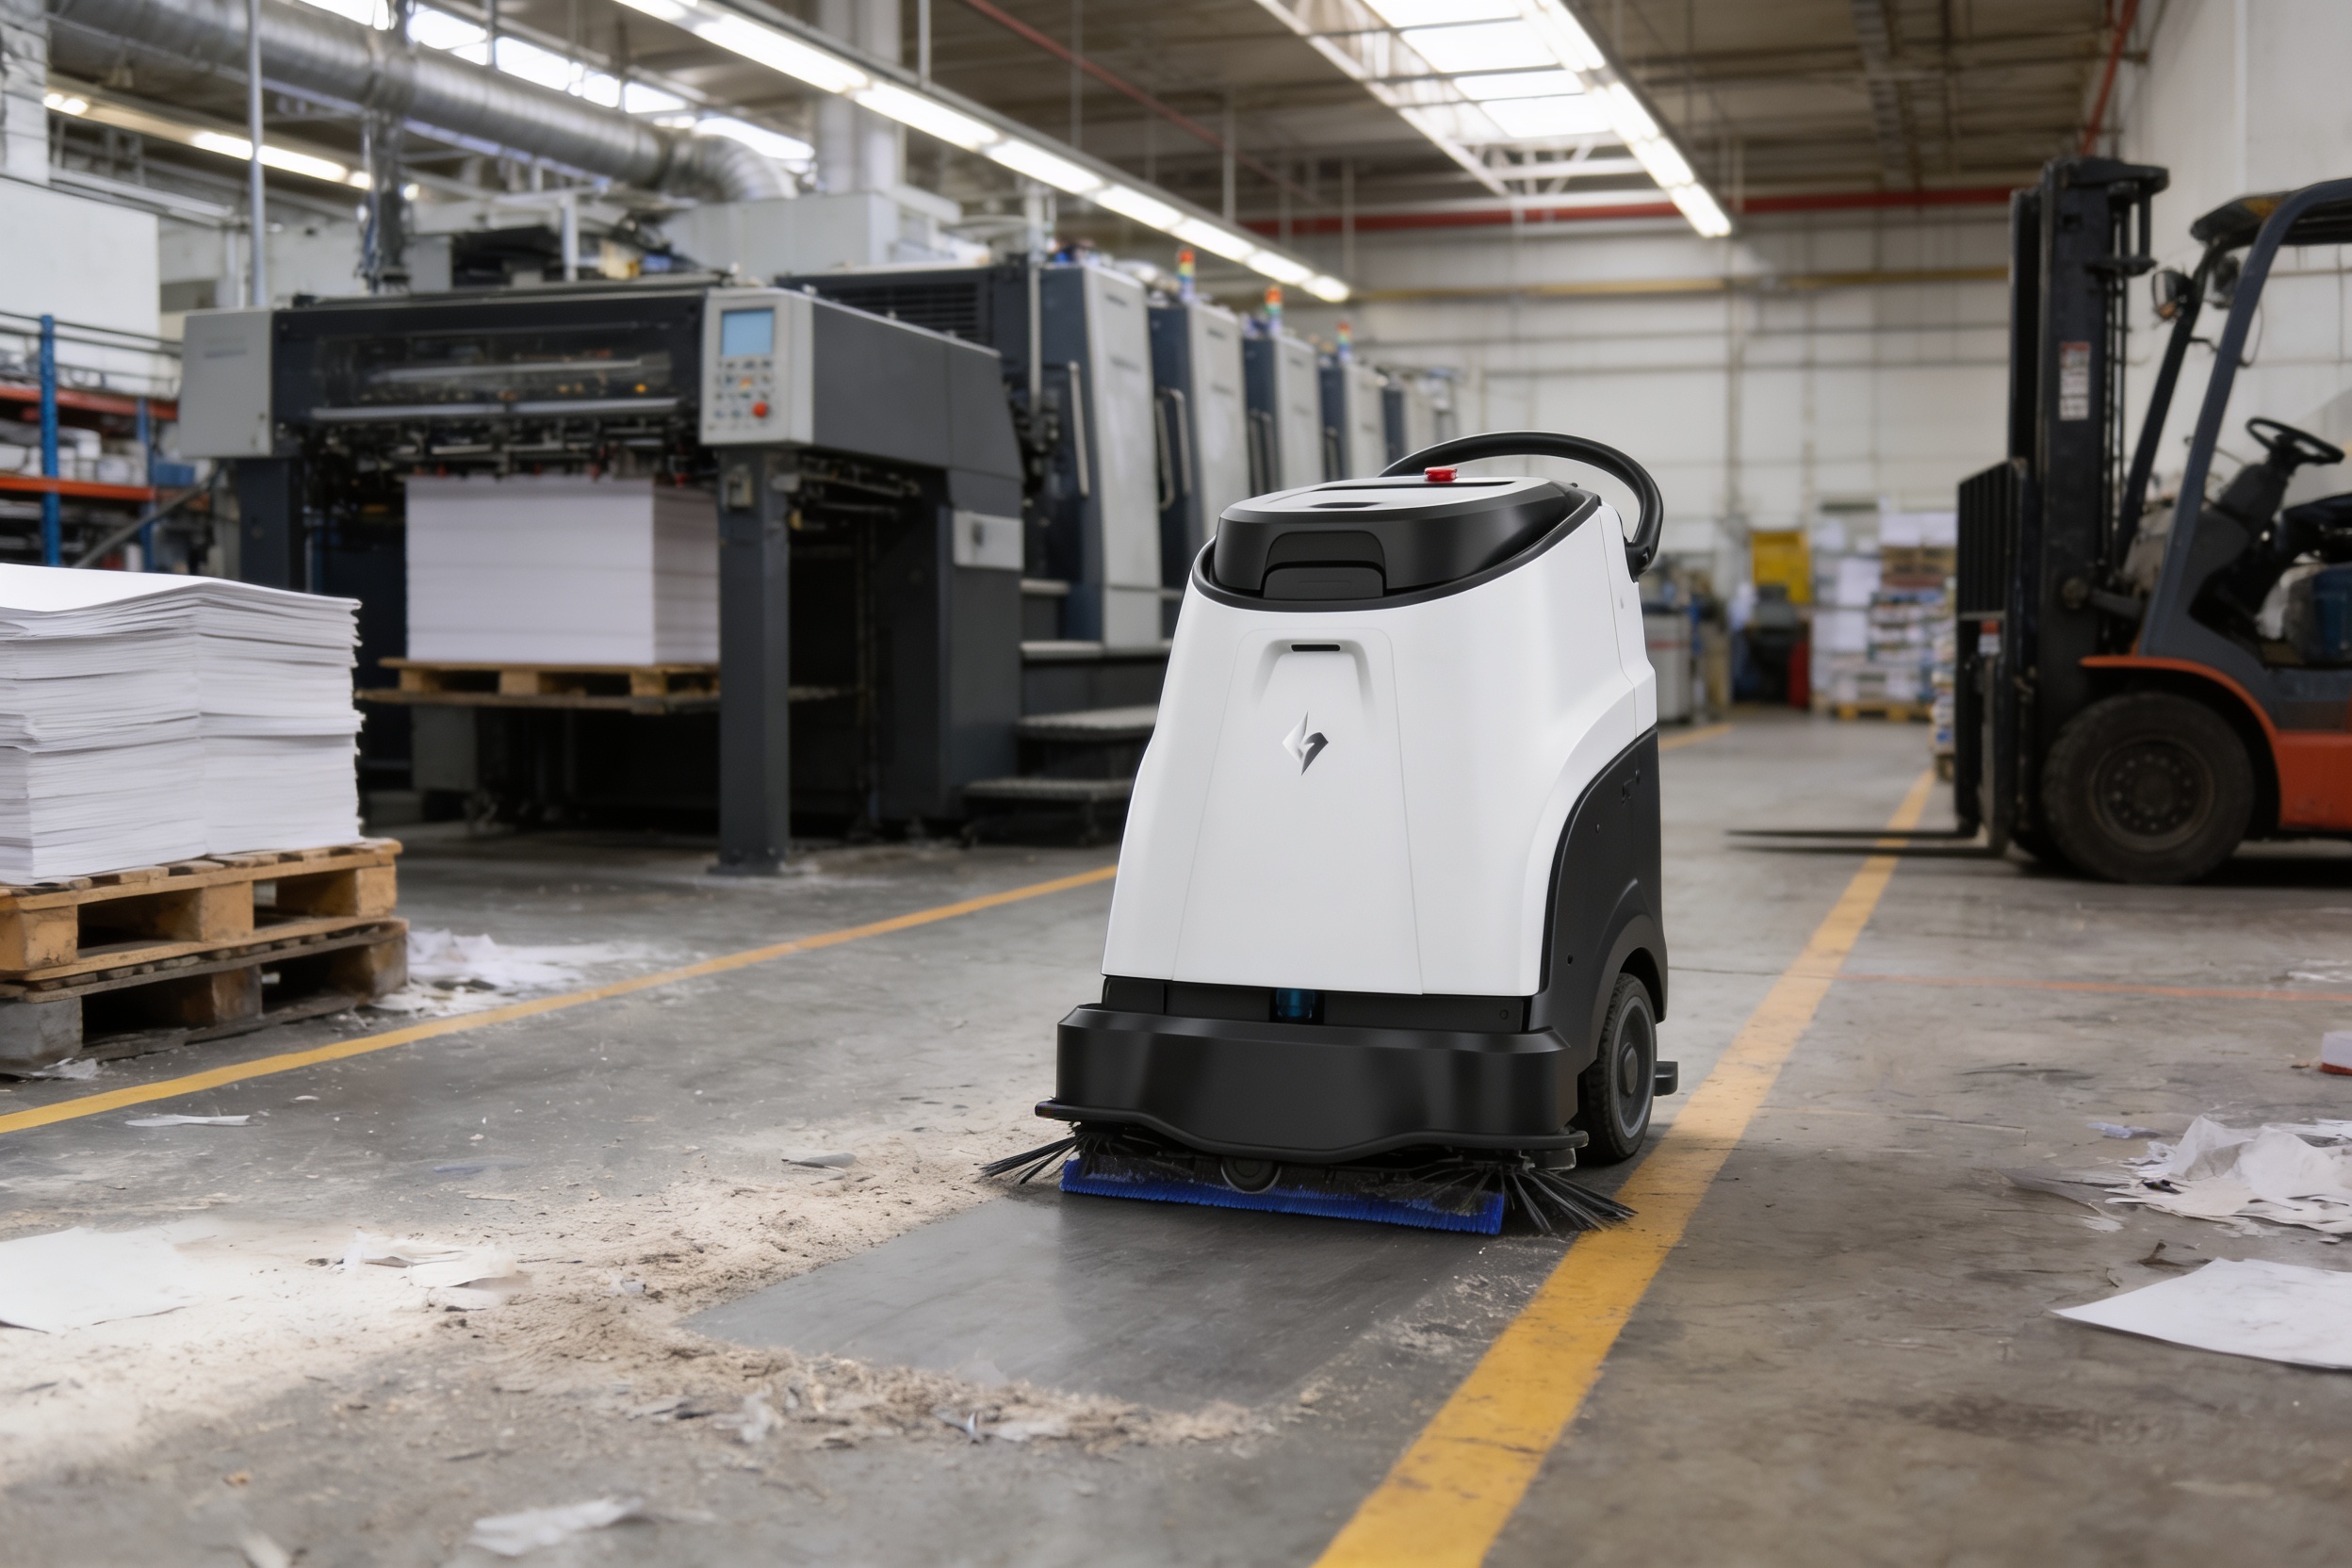
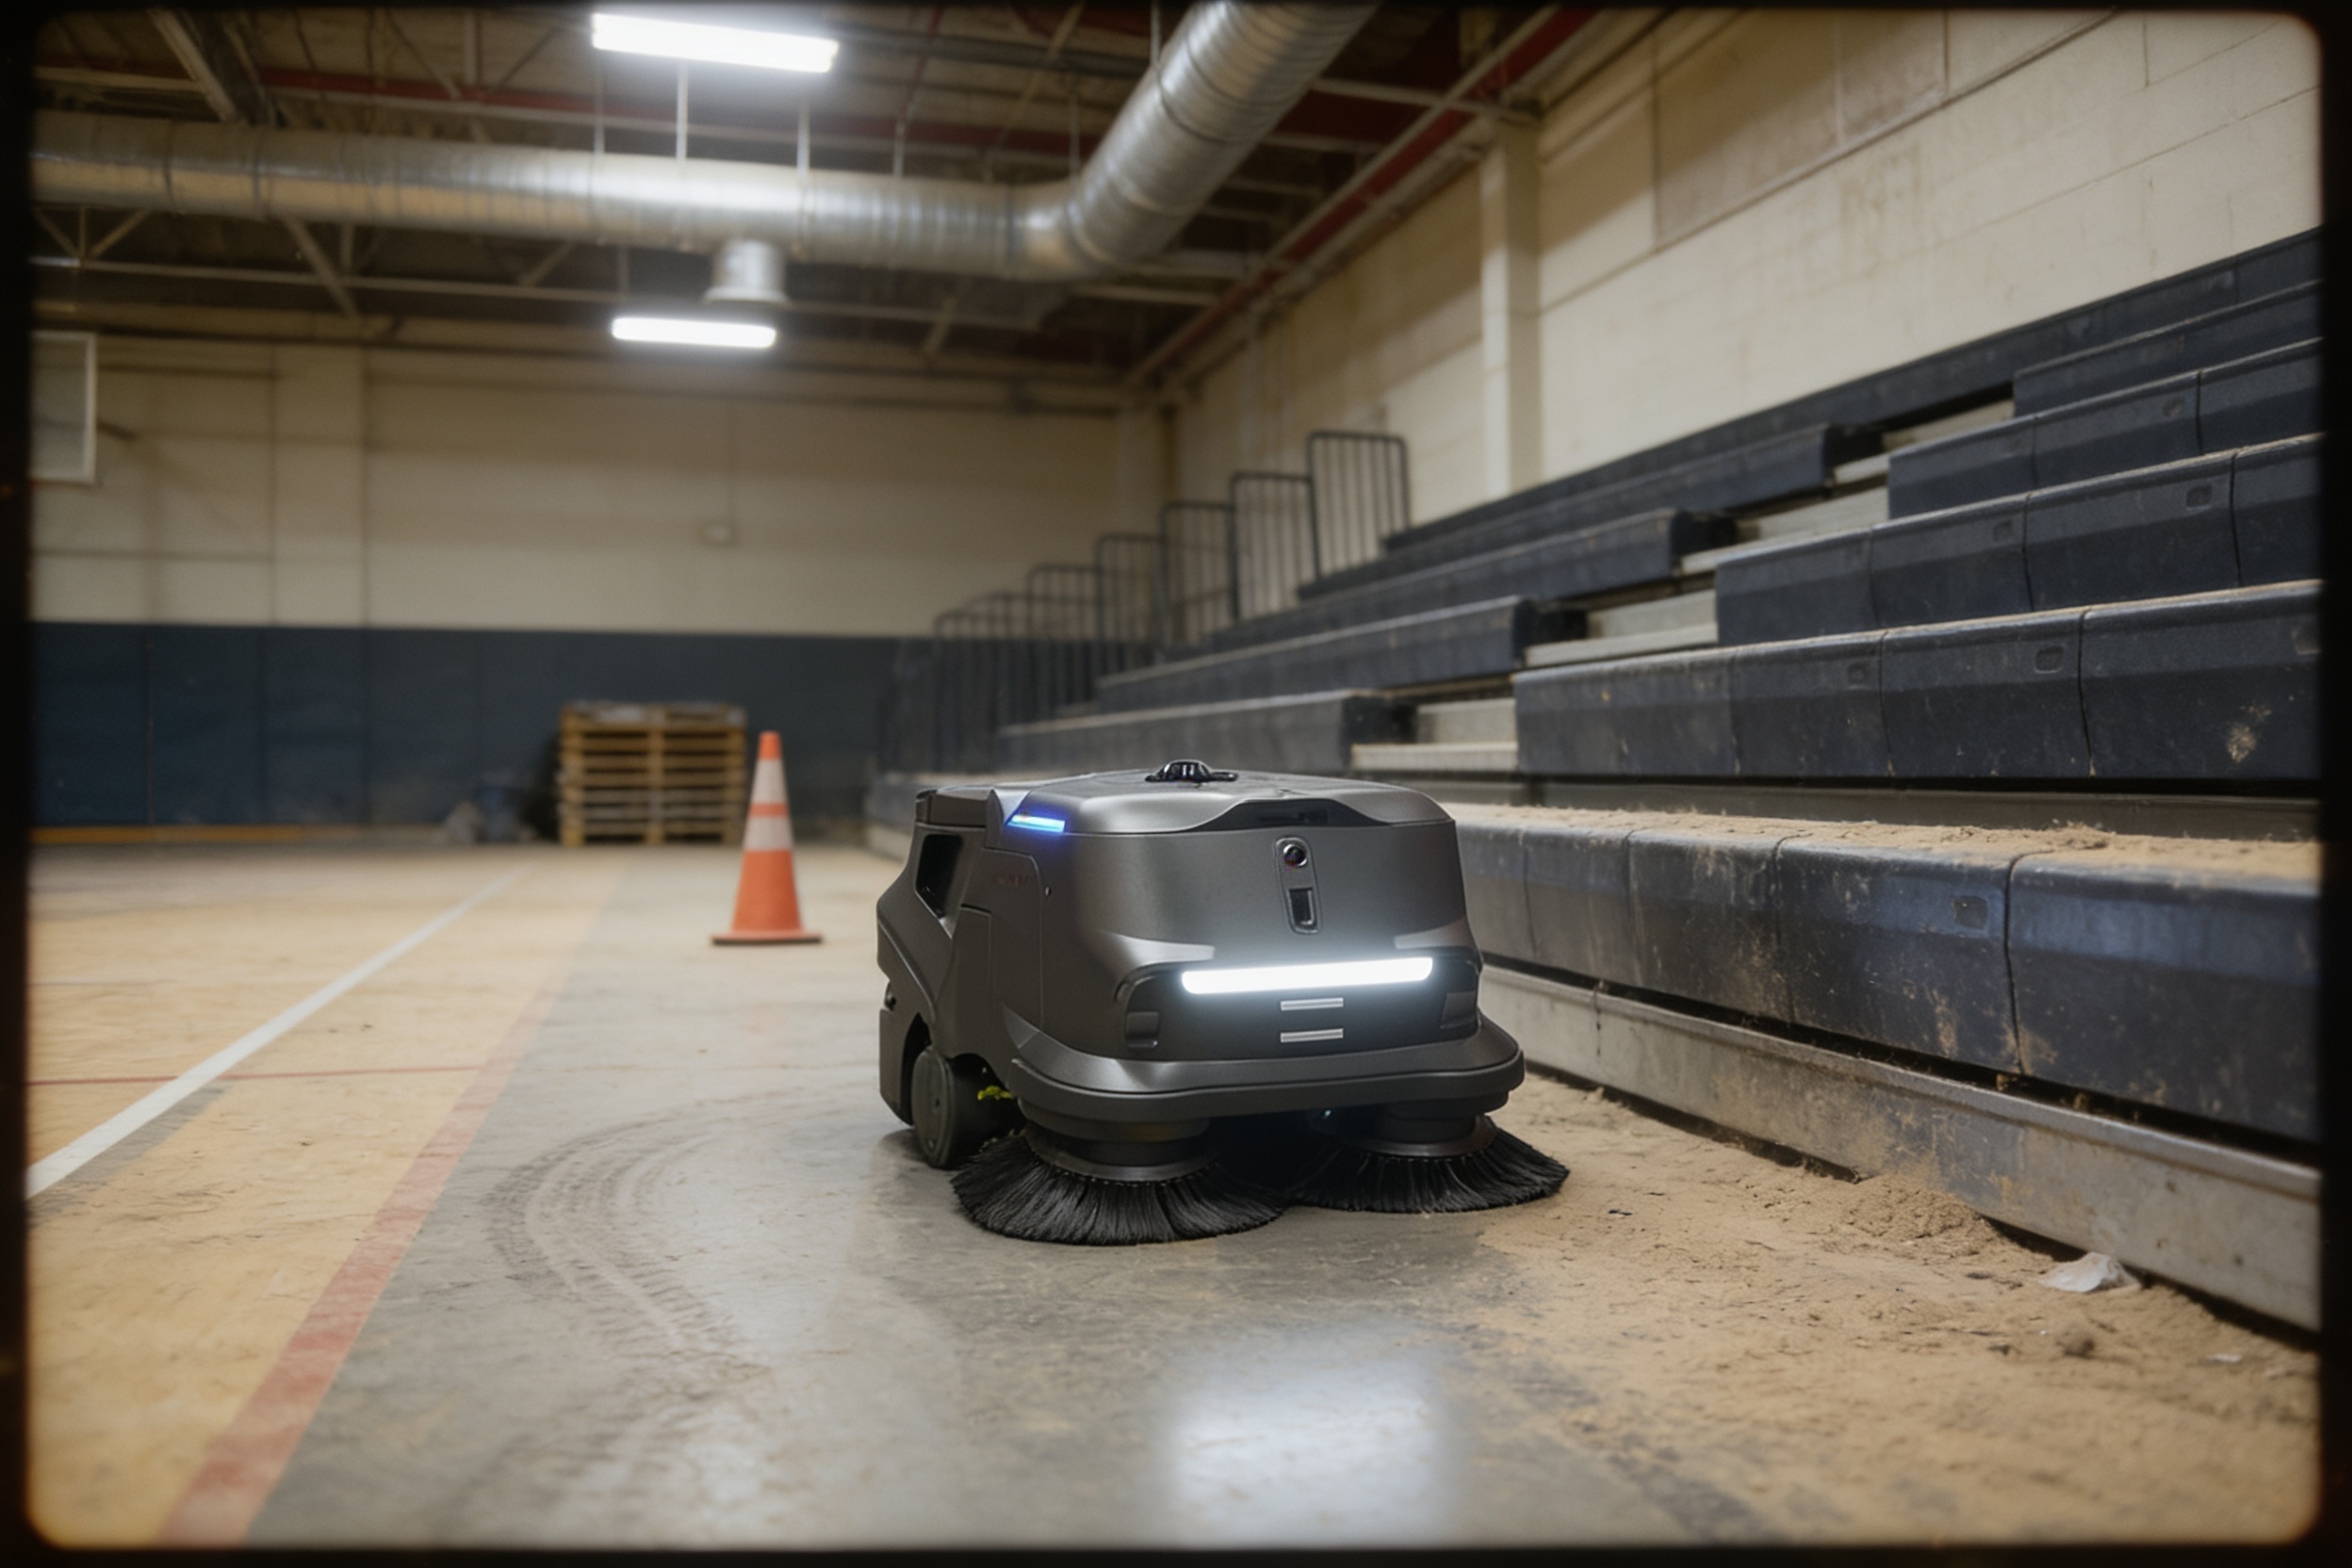
Vendor spec sheets for autonomous commercial floor scrubbers list rated coverage in square feet per hour, with the figure rising by model. Those are vendor-reported numbers for open floor under ideal conditions. The research for this page found no independent study of realized autonomous scrubber throughput in commercial settings, so rated coverage should be read as a ceiling, not a plan.
A vendor guide to commercial floor cleaning robots notes that real coverage runs below rated figures once doorways, furniture and foot traffic are counted. A theater lobby has all three: queue stanchions, lounge seating and guests crossing the route at the start of a show. Plan on the low end of the rated range and test the actual route during the site assessment.
Coverage is also a question of what counts as floor. A lobby is a mix of open route and fixed counters, so the gain sits in the open stretches between them. The site assessment maps those stretches before any lease is quoted, so the robot share comes from the floor you actually have.
- Repeat passes on open floor
Cleaning Robot
Same route, same order, on every gap
Staff
Tires over a long shift and can skip steps under pressure
- Fresh spill response
Cleaning Robot
Cannot respond to a new spill on its own
Staff
Responds quickly and cleans up the mess fully
- Off-hour work after the last show
Cleaning Robot
Runs a set route without an operator, subject to site rules
Staff
Needs a paid shift and supervision for the same run
- Edges, fixtures and furniture
Cleaning Robot
Needs a clear route and misses tight spots
Staff
Handles corners, fixtures and seating edges by hand
- Guest contact and judgment
Cleaning Robot
No judgment with guests or unusual situations
Staff
Handles guests, complaints and unusual calls
- Continuity when staff change
Cleaning Robot
Same route regardless of who is on shift
Staff
Depends on training and handover of the route
What changes the cleaning robot ROI up or down?
The biggest swings come from the open route share, the gap length, and whether the freed hours are reassigned. A lobby with clear sightlines and a long gap before doors open gives a robot a full pass. A concourse full of fixed counters and queue lines gives it fragments.
Floor type and staffing also move the number. Smooth hard floors help, while thick carpet, loose cords and stanchions reduce the share a robot can take. Higher turnover, as the 2015 Los Angeles figures describe, raises the value of a consistent route, but the offset only holds if someone owns the reassignment plan.
How safe is floor work in theaters, and what do injury rates show?
Theater-specific injury data is thin in the research for this page. The Bureau of Labor Statistics industry page for motion picture and sound recording, a wider group than theaters, lists a total recordable case rate of 1.5 per 100 full-time workers. The year is not shown in the source extract, so treat that rate as a broad reference.
BLS data for janitors and cleaners is more specific. The incidence rate for janitors and cleaners, except maids and housekeeping cleaners, in private industry was 191.6 per 10,000 full-time equivalent workers in 2020, after 157.4 in 2019. The latest year in the research is 2020, and no 2024 occupation-level rate was found.
Floor work carries slip and strain risk, and a robot takes some of the repetitive pushing off staff. It does not remove the need for spill response or for clearing cords and stanchions from walkways. Do not build the return on injury savings unless the site assessment measures them.
What are the risks to the return and how do you avoid them?
The biggest risk is counting hours that never leave the schedule. If the robot takes the open route and the same shift still walks it, the offset is zero. Set the reassignment plan before the lease starts, and tie it to a named role or shift.
The second risk is route failure on a busy night. A cluttered floor, a stuck cord or a missed stanchion can stop a run before the gap ends. Plan a clear-route check before the final gap, train staff to clear obstacles, and confirm the service terms cover downtime with on-site dispatch and a spare unit plan.
The third risk is trusting rated coverage. Test a pilot on one concourse before scaling to every house. We pick the robot for the floor, lease it through financing, deploy and integrate it, train the staff and service it nationwide, so the pilot route, the training and the service plan are set together.
How long does it take to reach payback, and how do you get an exact figure?
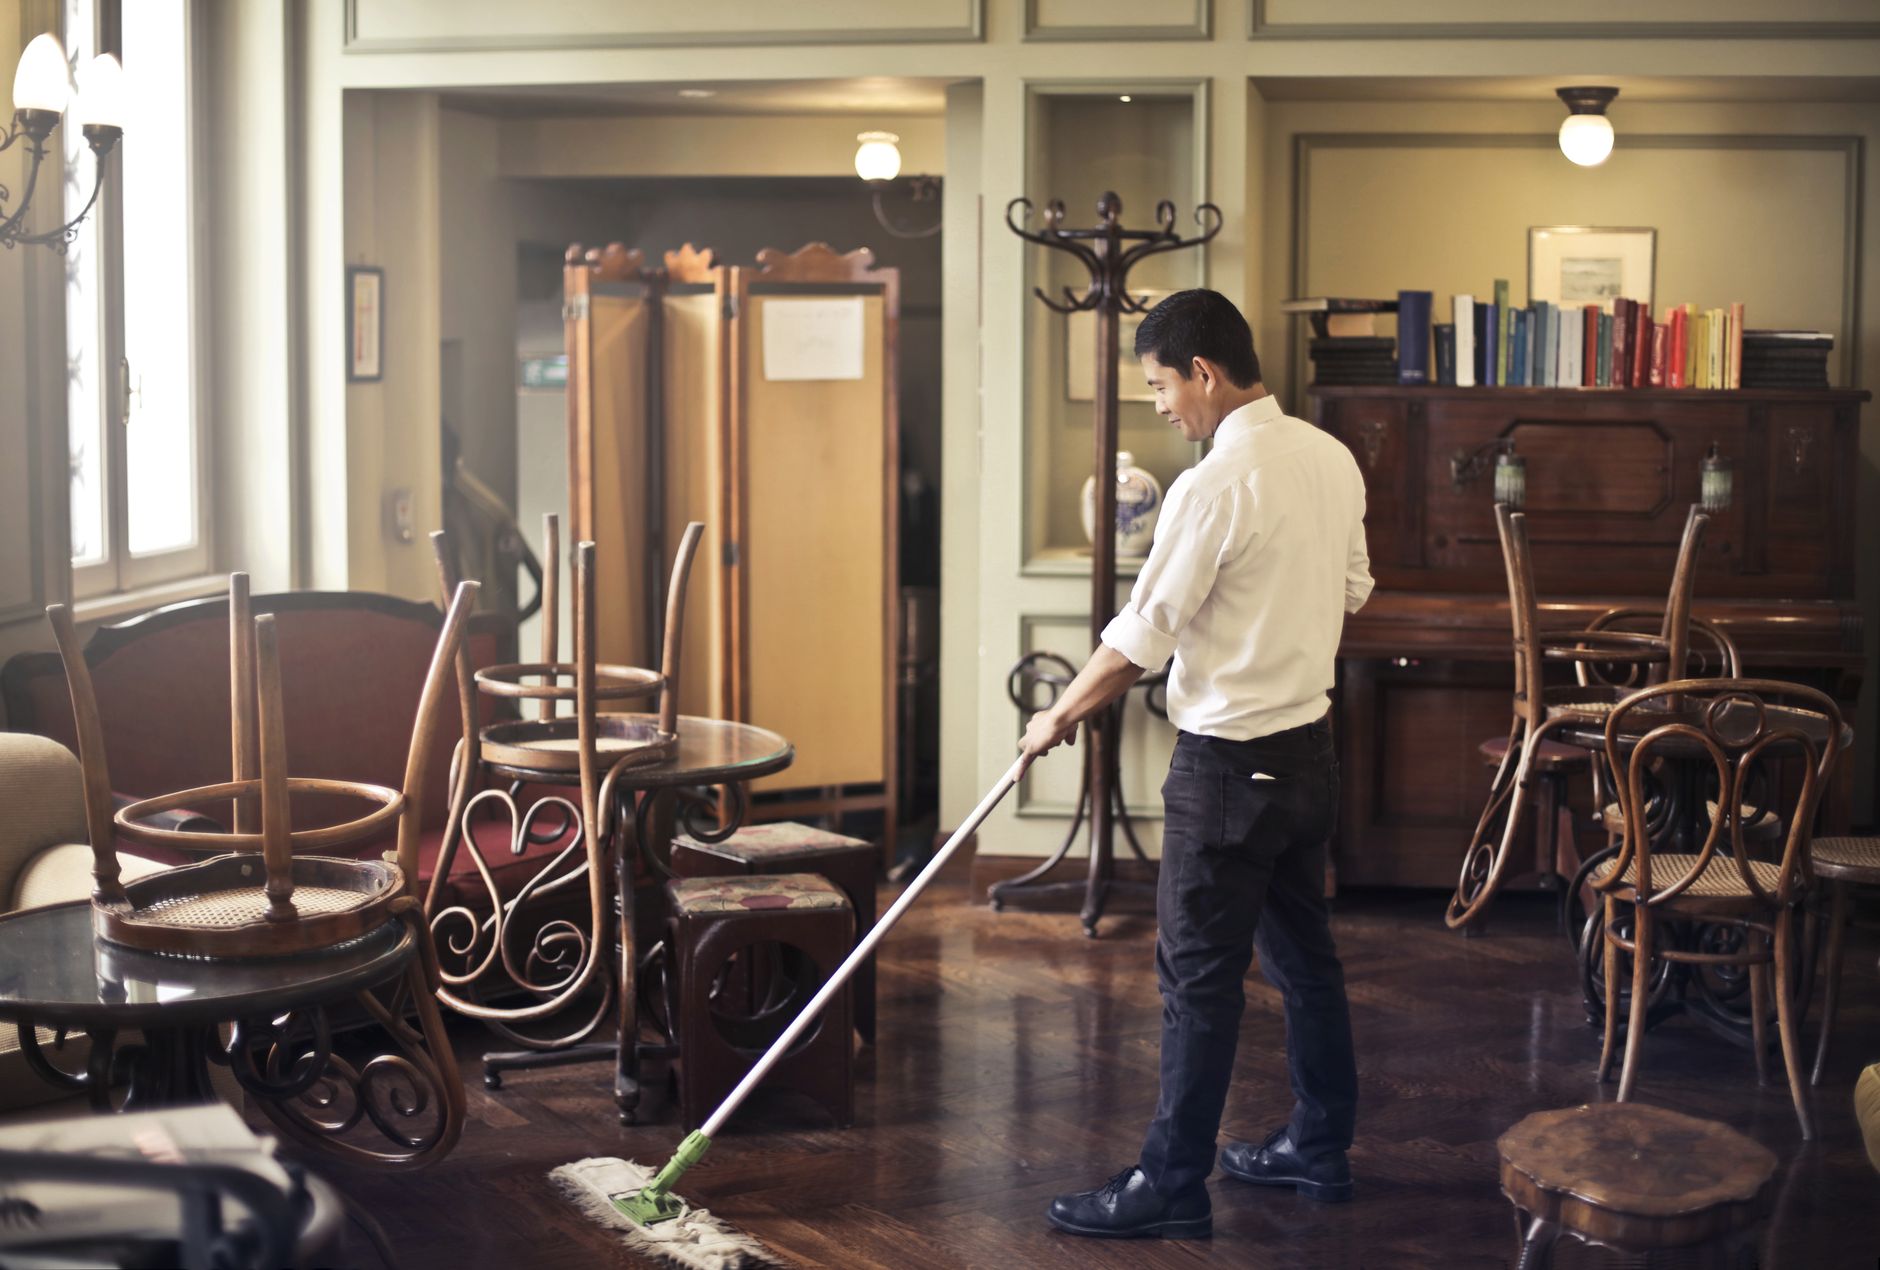
A typical path runs from a free site assessment to a lease quote, then to a pilot on one area, then to full deployment. The assessment maps the floor, measures gap length and open route share, and sets the robot share. The lease quote follows from that map and the term you choose, so the payment reflects your floor rather than a generic estimate.
Payback timing depends on the lease term, how quickly the reassignment plan takes effect, and whether the pilot route matches the full house. This page does not promise a timeline. Ask for a payback range with a low case and a high case, and check which assumptions drive each one.
Bring three inputs to the assessment.
- Crew hours on floor work, by area and by shift
- Number of houses in the building and the gap length between showings for each
- Staffing roster and turnover data you can share, even if it is partial
Frequently asked questions
Want a cleaning robot at your movie theater?
Tell us about your site. We will recommend the robot, quote the lease, and keep it serviced.
Sources
- US Bureau of Labor Statistics, Occupational Employment and Wage Statistics (OEWS May 2024)
- Trade coverage of the theater owners association rebrand, March 2025
- Bureau of Labor Statistics, Occupational Outlook Handbook: Janitors and Building Cleaners
- Bureau of Labor Statistics, injury and illness incidence rates for janitors and cleaners, 2020
- Bureau of Labor Statistics, industry injury rates for motion picture and sound recording
- Los Angeles City Clerk, 2015 staffing document for motion picture theaters
- Media History Digital Library, 1933 Census and 1931 BLS theater study