
The short answer
A cleaning robot ROI for hospitals comes mainly from floor work hours: hallway and common-area scrubbing on fixed routes, often run overnight, takes janitors and building cleaners type of work off the staff schedule. The return is a range, set by how much of that floor work a robot can run on its route, the hours your team spends on it, and the lease quote from a free site assessment. Published hospital studies report large cuts in mopping time, but the share that applies to your building is measured during the assessment.
Key takeaways
- Hospital return comes from scheduled hallway and common-area floor hours, not from clinical staff time.
- One Singapore hospital study measured mopping time falling 57 percent with autonomous floor scrubbers.
- Missouri hospitals reported environmental services turnover of 42.5 percent in 2025, which makes fixed floor routes harder to staff.
- The lease is quoted after a free site assessment, so the savings stay a range until the site numbers are in.
- Treat the first weeks of live operation as the test of the real share of work the robot runs.
Run the numbers for your site
Pick your city or state for a real regional number - we use the real BLS wage there. (On the live site this auto-detects from your location.)
What do you want to automate?
The robot runs the open floor overnight; your crew keeps detail and edges.
How much return can a hospital expect from a cleaning robot?
A cleaning robot ROI for hospitals comes mostly from staff hours. Hallway and common-area floor cleaning follows the same routes on the same schedule, which is repeated work a robot can run on a timetable while clinical staff stay with patients. The number is a range, not a fixed figure, because it depends on how many routes the building has, when they must be run, and what the lease costs once a site assessment prices the job.
This page covers where the hours come from, how the math works, what moves the result up or down, the risks to the return, a realistic timeline, and how to get a precise figure. Each published figure is named where it appears. The savings panel is pre-filled for hospitals, and a site assessment narrows the range it shows.
How many hospitals and floor workers are in this market?
The American Hospital Association's 2025 Fast Facts counts 6,093 total US hospitals, including 5,112 community hospitals, and 913,136 total staffed beds, based on 2023 Annual Survey data. The AHA's 2026 edition gives 6,100 total hospitals and 5,121 community hospitals, so the count shifts a little from one edition to the next. Most of those buildings have long corridors, shared lobbies and steady foot traffic.
The Bureau of Labor Statistics Occupational Outlook Handbook reports about 2,447,700 janitor and building cleaner jobs in 2024, with 2 percent projected growth from 2024 to 2034, or 47,800 jobs. Its largest employers are services to buildings and dwellings at 35 percent and educational services at 17 percent. Hospitals are not in the top two, so the hospital floor workforce is a small slice of that national total, and the staffing picture for your site has to come from your own records.
Median hourly wage, Janitors and Building Cleaners
$4,041
Monthly cost of one full-time worker, at the median wage plus payroll costs (an estimate, not a quote).
Where does the return come from in a hospital?
In most hospitals, environmental services (EVS) staff do the floor work that the janitors and building cleaners group covers: mopping, scrubbing, sweeping and emptying waste in corridors, lobbies, cafeterias and waiting rooms. The labor side of the savings is priced on that kind of work, not on the time of nurses or other clinical staff. The robot takes janitors and building cleaners type of work off the EVS team, and clinical staff keep their patient work.
The return comes from three places. First, scheduled hours of route scrubbing move to the robot, often in the overnight or low traffic window. Second, hours that used to go to repeated route work can be assigned to other cleaning tasks, as one Hong Kong hospital did when it moved freed hours to public toilet cleaning. Third, a fixed route runs on time even when the team is short, so floors stay on schedule when shifts go unfilled.
How does the savings math work?
The math starts with hours. Take the weekly hours your team spends on hallway and common-area floor work, multiply by the share of that work a robot can run on its route, and value those hours at the local wage for this job from the government data panel next to this text. That gives the labor offset. The calculator shows a range because both the hours and the share change from site to site.
The second side is the lease. The lease is a fixed robot lease payment, and we quote it after a free site assessment, so the number reflects your routes and not a generic estimate. The return is the labor offset minus the lease, plus any value from hours you reassign to other work. We service the robots nationwide, so repair work does not land on your staff, and the result is always shown as a range.
What do hospital floor-care studies show about hours?

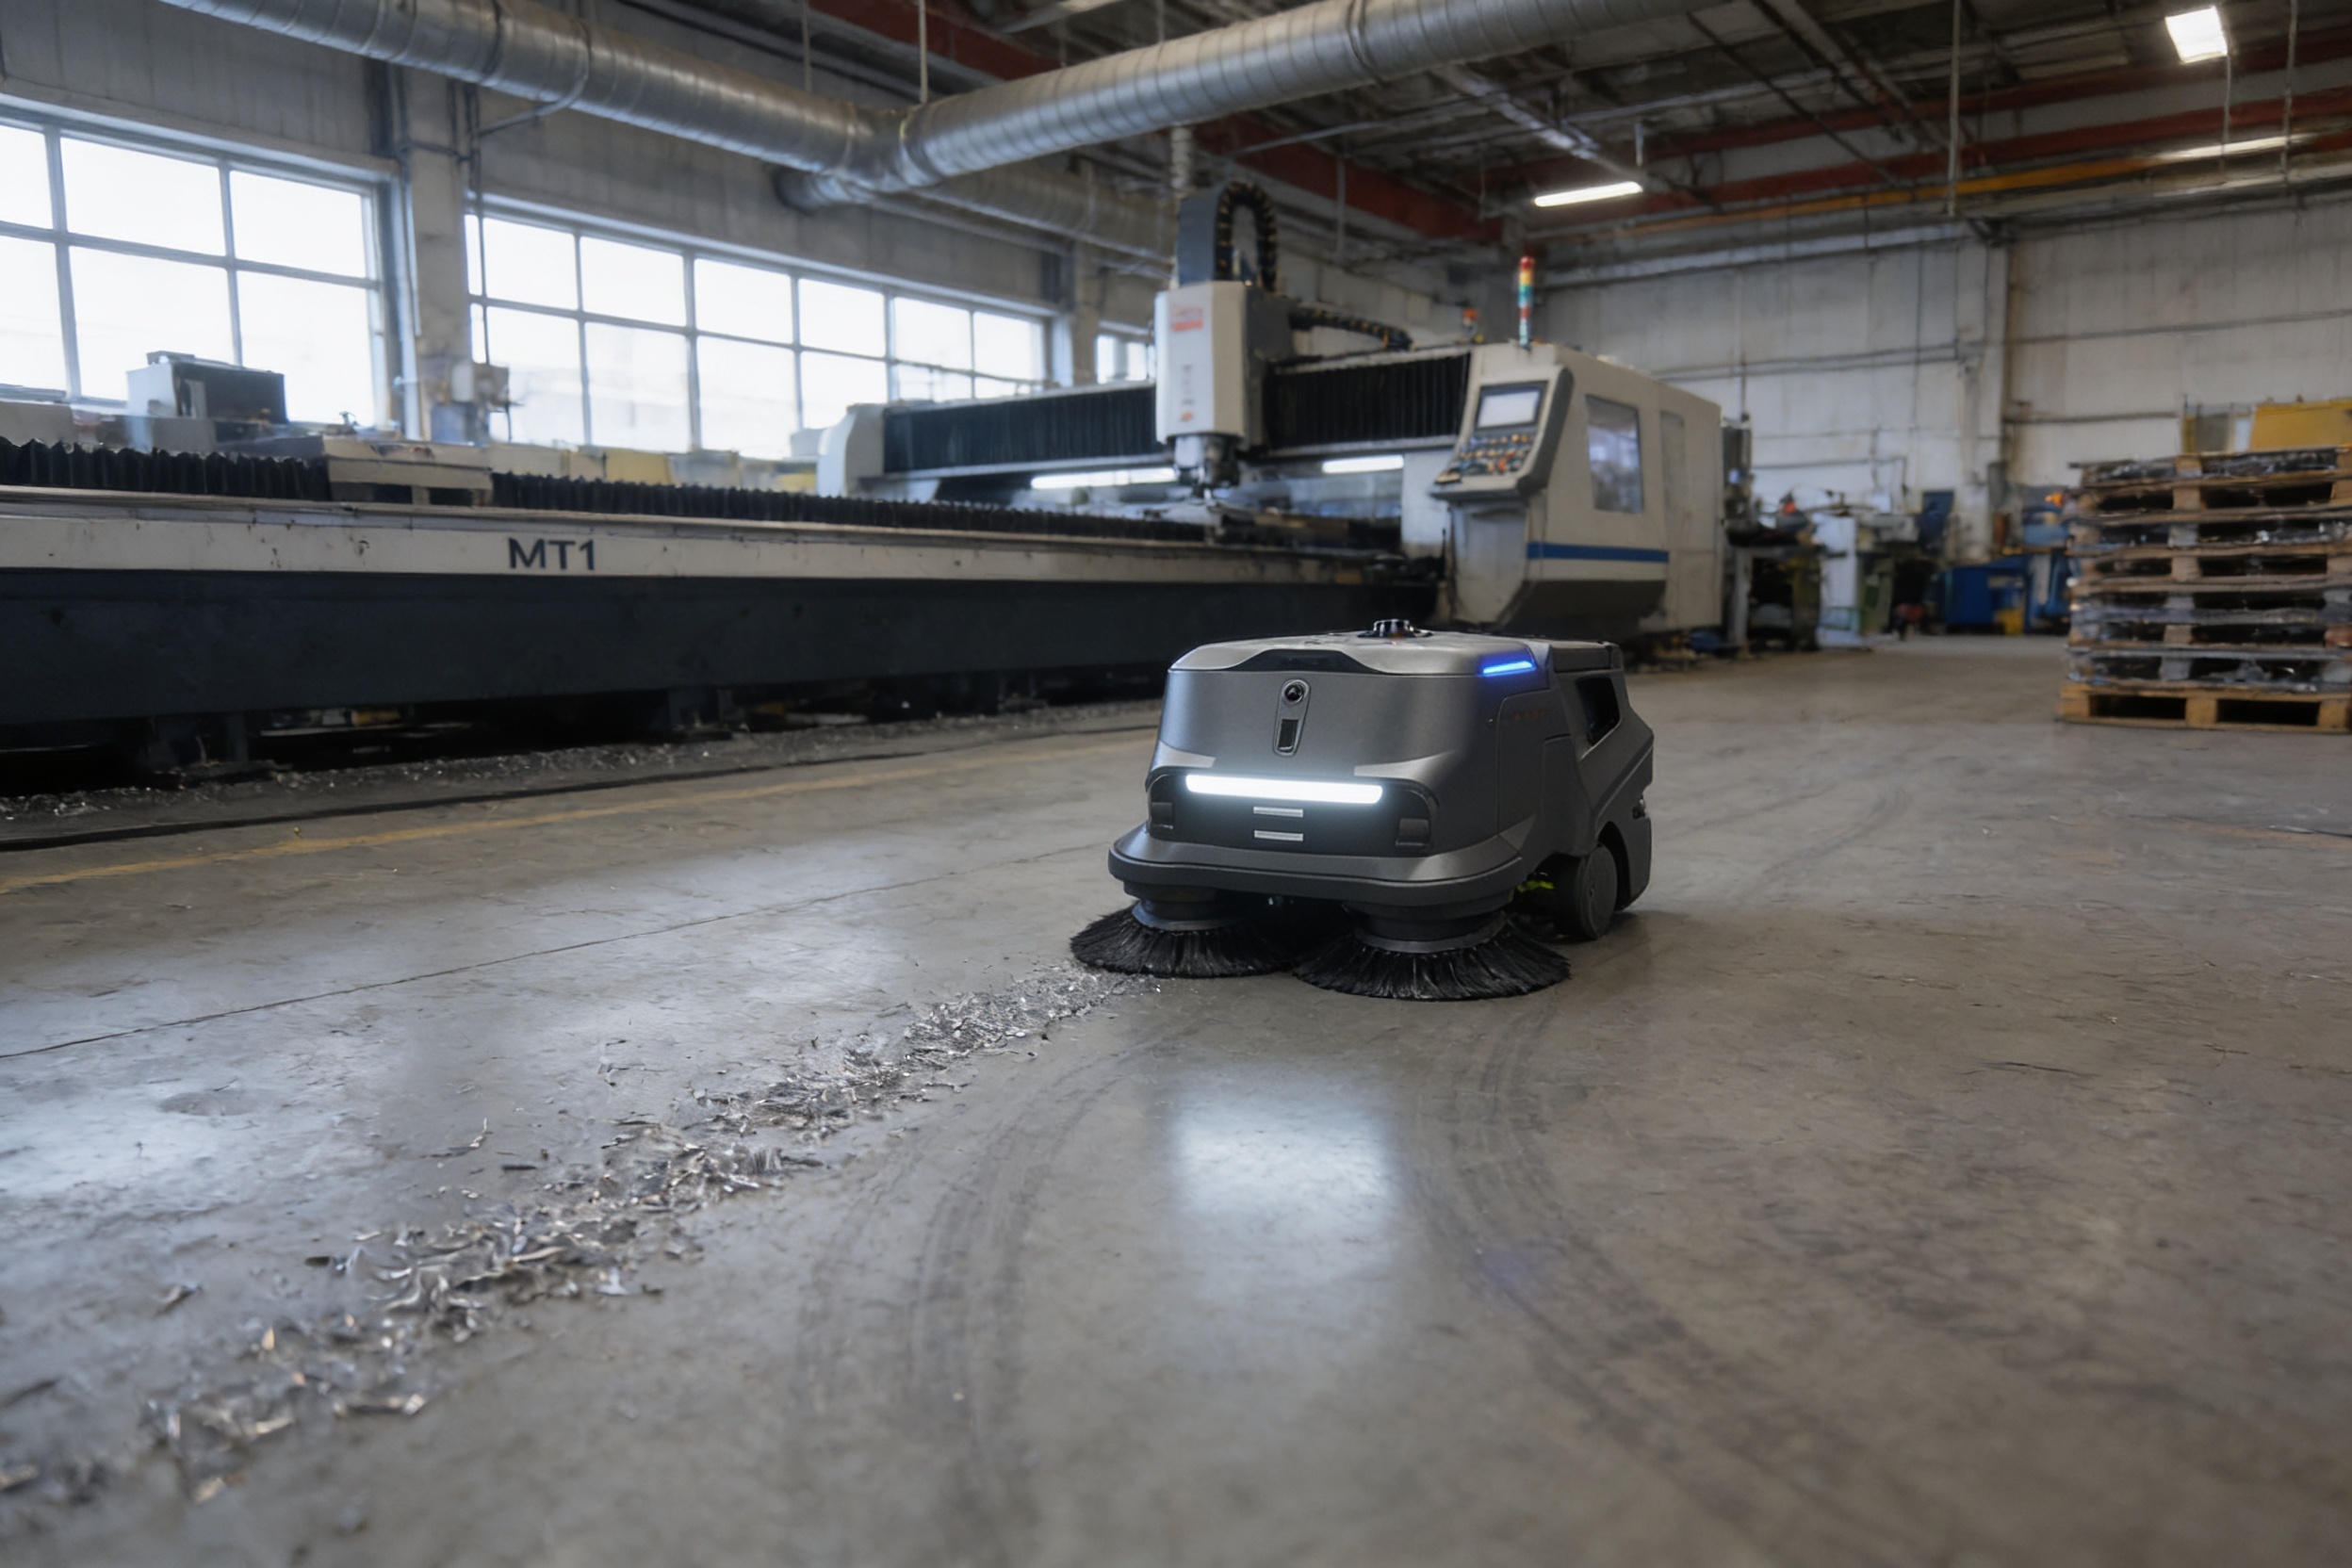
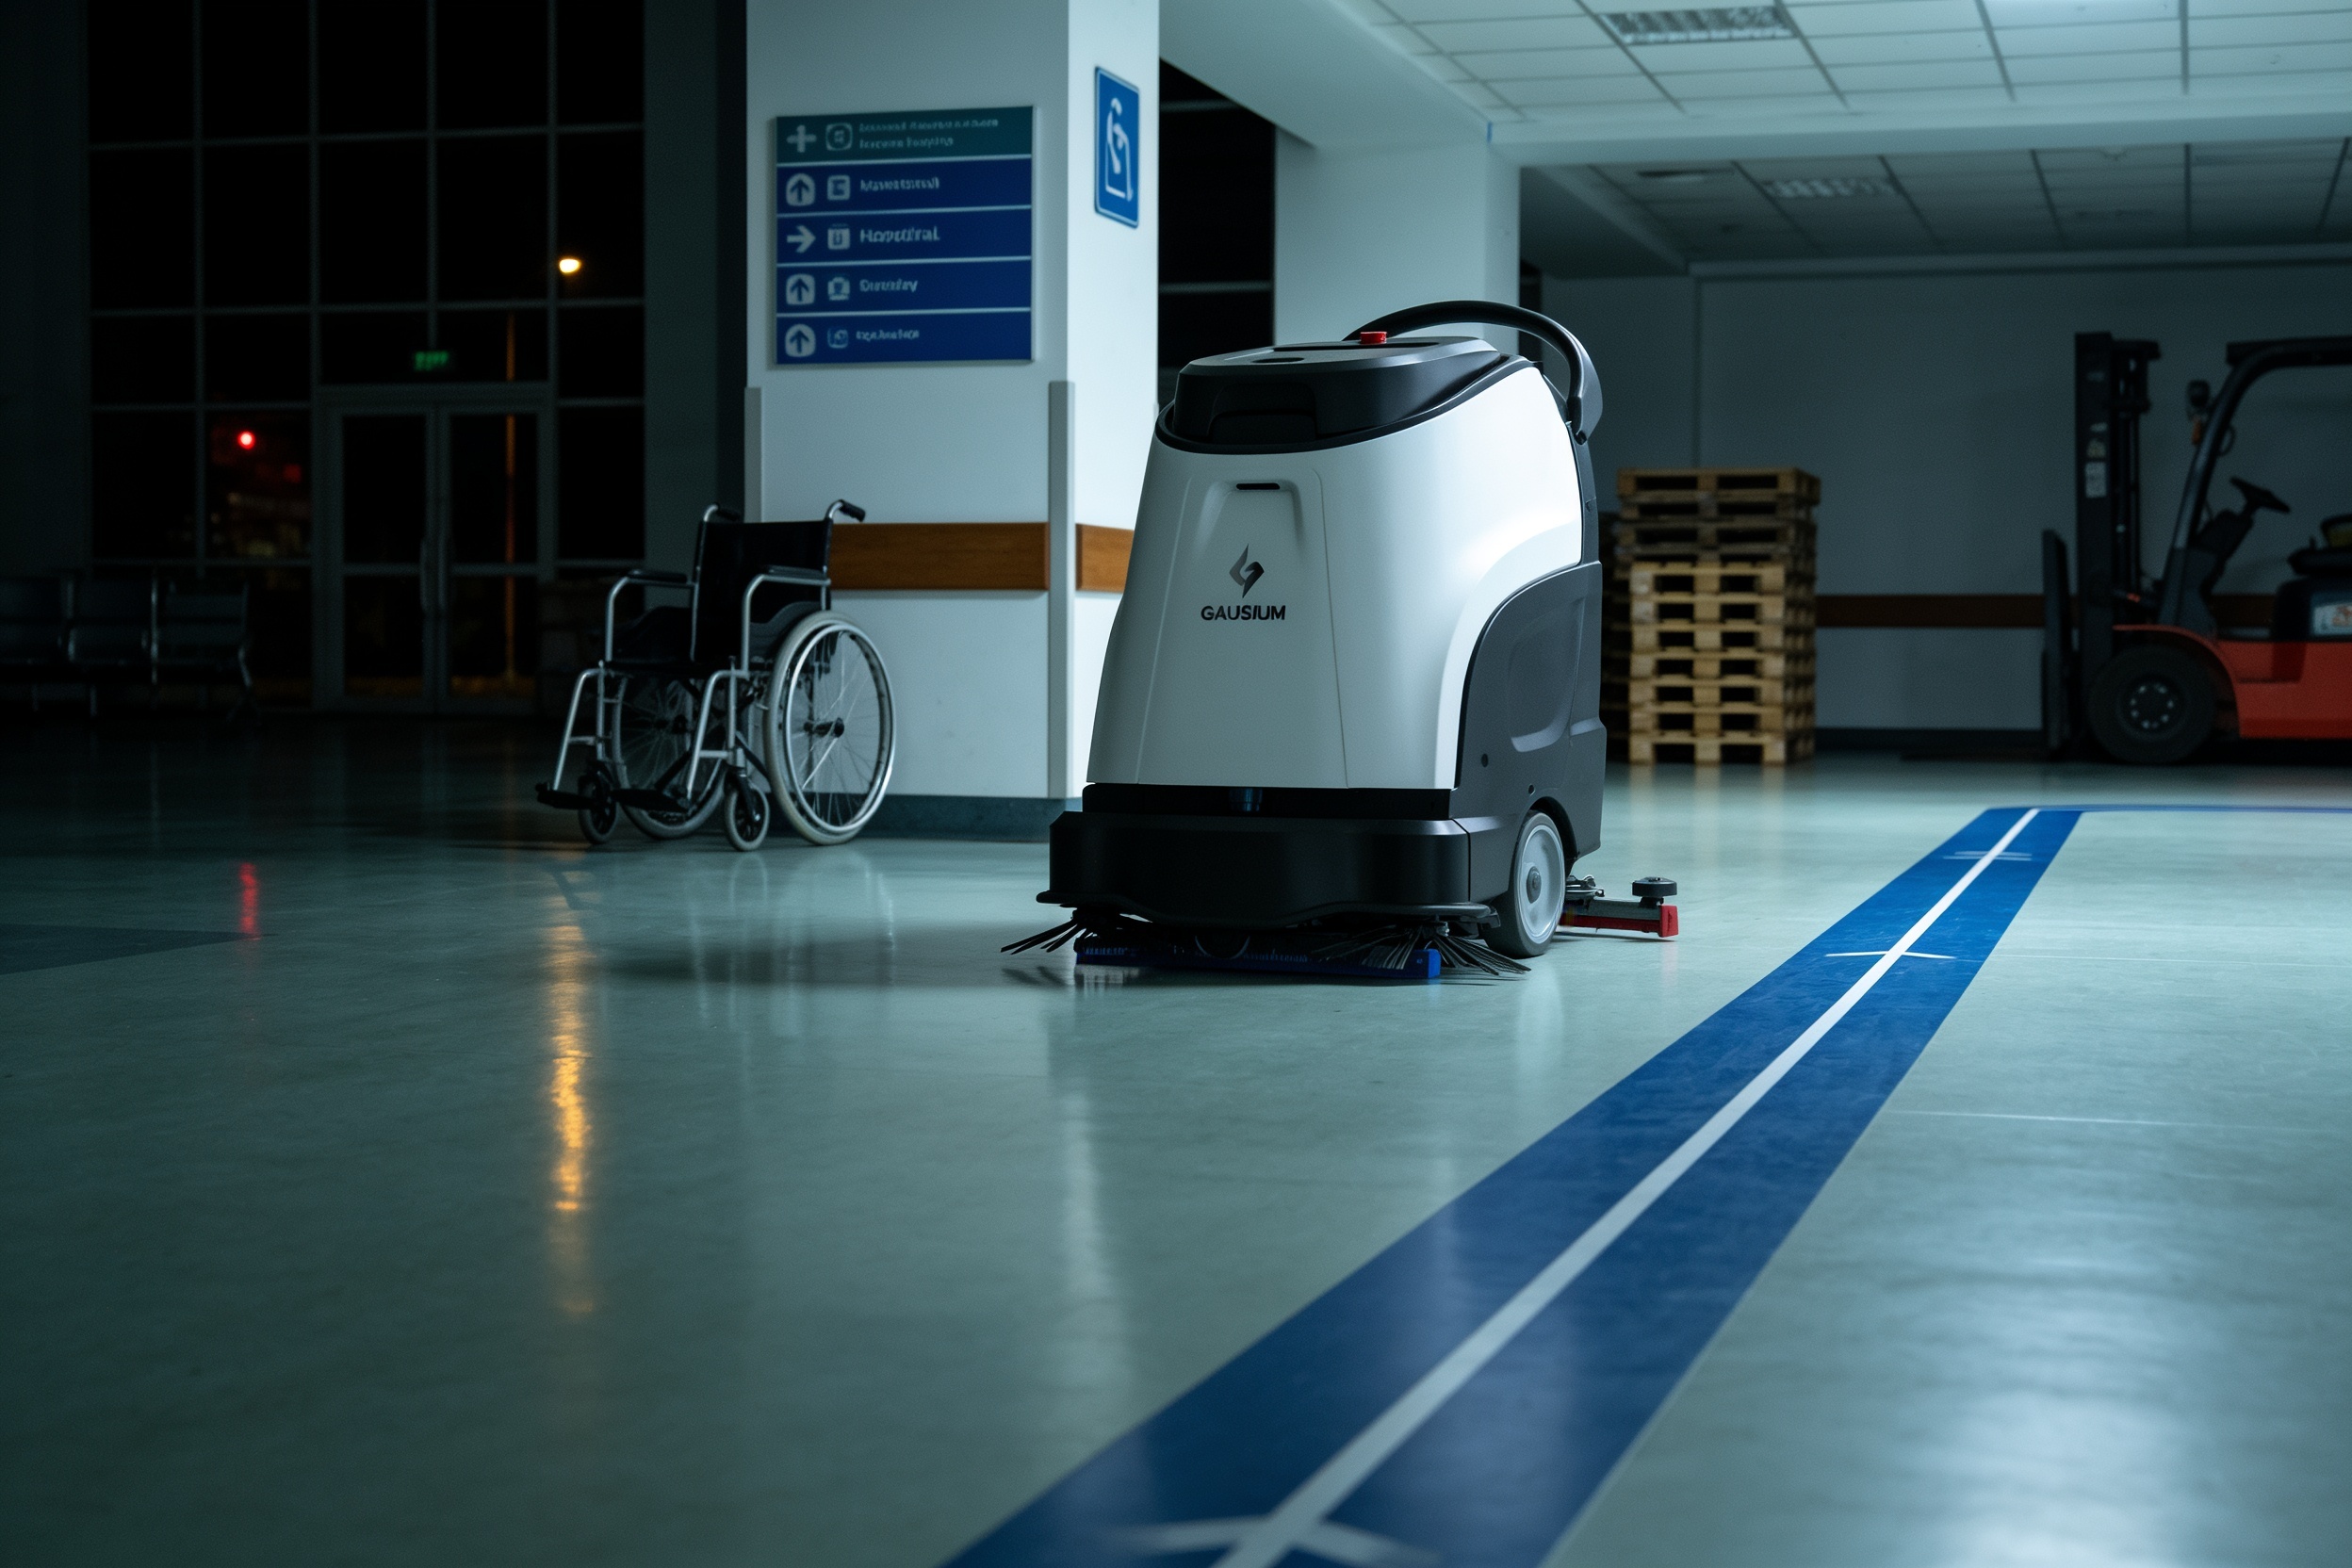
The best documented figures come from institutional studies. A 2021 PDSA study of autonomous floor scrubbers at a Singapore hospital found that mopping time fell by 57 percent, from 35 minutes to 15 minutes. A 2021 Hong Kong hospital conference abstract reported 189 man-hours a month going to mopping public areas before its robot, and that after introduction those hours were redeployed to cleaning public toilets.
A third data point is a 2023 vendor-reported case at a US hospital network. The vendor said two robots replaced a three-person team, scrubbing hours fell 50 percent, and total nightly floor-care labor went from 16 hours to 5 hours. That case was not independently verified, so read it as a sign of what is possible and not as a forecast for your building.
Why does staff turnover change the return?
Turnover makes scheduled hours hard to hold. Missouri Independent reporting says environmental services turnover reached 42.5 percent in Missouri hospitals in 2025. Cleveland Clinic's internal figures show EVS turnover falling from 43 percent in August 2024 to 37 percent in July 2025 while the system ran task forces on turnover, which shows the rate can move but still stays high.
The BLS Occupational Outlook Handbook says most janitors and building cleaners learn on the job, so every vacancy means new training time. A fixed route keeps the corridors on schedule while a position is open, and that is where the return is strongest. Where the team is fully staffed and stable, most of the offset is simply the hours themselves.
What changes the number up or down?
Route count and length matter most. A building with long, open corridors gives a robot more usable coverage per hour than one with many small rooms, carts and furniture in the path. Shift timing matters too, since overnight runs use hours that would otherwise sit idle, while daytime runs have to work around patients, visitors and transport.
Staffing reality moves the number. A team with open shifts and high turnover gets more offset from a steady route than a fully staffed team does. Multi floor access, elevator use and the number of entrances also change what the robot covers on a single route. Each of these is checked during the site assessment, and the result feeds the range on the calculator.
What are the risks to the return and how do you avoid them?
The first risk is overcounting the share of work the robot takes. Patient rooms, clinical areas and busy zones usually stay with staff, so the calculator should count only the route work a robot can run. Map the routes before counting hours, and treat the first deployment as a test of the real share.
The second risk is idle time. If freed hours are not assigned to other cleaning tasks, the return shrinks to whatever direct cost the lease displaces. The Hong Kong abstract shows that the reassignment decision matters, so set the plan for freed hours before go live.
Injury data is worth a look. Business Insurance, reporting BLS 2024 data, says the total recordable case rate for health care and social assistance fell to 3.4 from 3.6, and overexertion and repetitive motion were the leading causes of serious cases in 2023 and 2024. Moving repetitive floor work to a robot can be part of the safety case, but the published data does not prove a reduction for your staff, so track it in your own incident log.
What is a realistic timeline from assessment to payback?
The timeline runs in phases: site assessment and mapping, the lease quote, financing approval, deployment and integration, staff training, then go live support. The length of each phase depends on the building, the route count and the financing review, so we do not publish a fixed number of weeks before the assessment. Ask for the schedule in the quote, with each phase named.
Payback follows go live. The first weeks of real operation show the actual share of route work the robot runs, and that replaces the planning estimate. Once the real share is known, the payback point comes from the labor offset set against the fixed robot lease payment, and the range narrows. A phased start, with one leased unit on a single wing, tests the share before the full route set is committed.
How do you get a precise figure from a free site assessment?
A free site assessment gives a more precise figure than the calculator range. We map the floor routes, record the hours your team spends on hallway and common-area work, check floor types, thresholds and obstacles, and note elevator use and shift patterns. Then we choose the right robot for the site and quote a fixed robot lease payment through financing.
We are a US commercial robot integrator. We lease the robot through financing, deploy and integrate it, train your staff, and service it nationwide, so one partner handles the whole program. The quote arrives with the site numbers behind it, and the savings stay a range because the first months of live operation set the final share of work.

Frequently asked questions
Want a cleaning robot at your hospital?
Tell us about your site. We will recommend the robot, quote the lease, and keep it serviced.
Sources
- US Bureau of Labor Statistics, Occupational Employment and Wage Statistics (OEWS May 2024)
- AHA 2025 Fast Facts on US Hospitals
- AHA 2026 edition hospital counts, via ASHE
- BLS Occupational Outlook Handbook: Janitors and Building Cleaners
- Missouri Independent
- Cleveland Clinic internal turnover figures
- Singapore hospital PDSA study on autonomous floor scrubbers, 2021
- Hong Kong hospital conference abstract, 2021
- Business Insurance on BLS 2024 workplace injury data