
The short answer
Cleaning robot ROI in Grand Rapids, MI comes from the janitor and building cleaner hours a robot takes off the schedule, valued at the local wage for this job in the government wage data on this page. The savings range depends on how much of the floor the robot realistically covers, the hours already spent on those tasks, and the fixed robot lease payment quoted after a free site assessment. Because the range moves with each building, use the calculator on this page as a starting point and the assessment figure as the one to sign against.
Key takeaways
- The return comes from janitor and building cleaner hours the robot takes off the schedule, not from a whole job disappearing.
- The savings range moves most with the share of floor the robot realistically covers and the hours already spent on it.
- Turnover figures conflict across sources, so measure your own vacancies and overtime from payroll records.
- Injury rates for this occupation are high, but any safety benefit stays outside the savings range on this page.
- A free site assessment sets both the hours and the lease payment, so this page gives a method, not a quote.
Run the numbers for your site
Auto-detected from your location - we use the real BLS wage here. Not right? Pick your city or state above.
What do you want to automate?
The robot runs the open floor overnight; your crew keeps detail and edges.
What return can a cleaning robot deliver in Grand Rapids, MI?
Cleaning robot ROI in Grand Rapids, MI comes down to one question: how many hours of janitorial work does the robot take off the schedule, and what are those hours worth at the local wage for this job. The government wage data on this page supplies the labor side. It does not tell you how many cleaning hours your building uses, so the range here is a method with inputs, not a promise.
The research behind this page did not return Grand Rapids establishment counts or floor area figures, so it makes no local business claims. It uses national sources for the occupation and the industry, and applies them to Grand Rapids through the local wage panel. Where a figure is national, the text says so.
Scope matters too. The Census definition for this industry covers establishments primarily engaged in cleaning building interiors, transportation equipment interiors, and windows, which is the work this page is about.
Where does the return come from in building cleaning?
Janitors and building cleaners held about 2.4 million jobs in 2024, according to the Bureau of Labor Statistics Occupational Outlook Handbook. The same source projects employment to grow 2 percent from 2024 to 2034, which is slower than the average for all occupations. Slow headcount growth does not mean the work goes away. It means the labor pool is not expanding quickly, and a site that loses a cleaner may wait longer to refill the shift.
The handbook also projects about 351,300 openings a year on average over the decade. Those openings include replacements for workers who leave, so it is the closest official proxy for turnover in this occupation. Every opening is a shift someone has to cover, and that is where the return starts.
The return has three sources. The first is the janitorial hours the robot takes over on a set schedule, mainly scrubbing and sweeping open floors. The second is avoided overtime and temporary cover during vacancies. The third is steadier floor condition, since the robot runs the same route each time rather than when a shift happens to have spare time.
Median hourly wage, Janitors and Building Cleaners
$3,910
Monthly cost of one full-time worker in Grand Rapids, MI, at the median wage plus payroll costs (an estimate, not a quote).
How does the savings math work?
The method has four inputs. The first is the hours of janitor and building cleaner work the robot realistically takes over, measured on your floor. The second is the local wage for this job from the government wage data on this page, applied to those hours. The third is the lease cost, a fixed robot lease payment quoted after a site assessment. The fourth is the cost the robot avoids, such as overtime or temporary cover for open shifts.
The range comes from the difference. Covered hours multiplied by the local wage gives a gross labor value. Subtract the lease payment and the staff time the robot still needs for setup, checks and exceptions. What remains over a year is the savings range. Until the floor is mapped, the range should stay wide.
The share is the number most often overstated. A robot takes the open, repetitive, reachable floor. It does not take restrooms with fixtures, stairs, a loading dock, or work that needs a person's judgment. Most realistic plans cover part of the floor and keep people on the rest, so the robot's share of total cleaning work is the first variable to pin down.
Crew size also shapes the math. A business density aggregator citing Census County Business Patterns for 2023 shows that about 61 percent of janitorial services establishments employ fewer than five people. That suggests a typical site runs a small crew, around four people. This is a planning assumption drawn from that size split, not a government count per site, and the assessment replaces it with your actual headcount.
| Task | Today | With a robot |
|---|---|---|
| Scrub open corridors and common floors | Measured at site assessment | Runs a set nightly route, staff check the result |
| Sweep and vacuum open floor areas | Measured at site assessment | Runs on schedule, staff clear obstacles before the run |
| Restrooms, fixtures and detail cleaning | Measured at site assessment | Stays with staff |
| Setup, resets and dock checks between runs | Measured at site assessment | Short setup and dock check by staff |
| Vacancy cover and overtime | Measured at site assessment | Reduced when the robot holds the route |
No hour figures on this page come from a published source. Each row is timed on your floor during the site assessment, and the robot column reflects planned setup and checks.
What changes the number up or down?
The same robot can produce a very different return in two buildings. The largest swings come from the hours already on the schedule, the layout of the floor, and how often the site loses people. Each one moves the range in a predictable direction, so the checklist below lists what to answer before treating any range as your own.
Dense, open floors with long runs raise the robot's share. Carpet, thresholds, moving furniture and many stairs lower it. Frequent vacancies raise the value, since the robot holds its route through a gap. A site that already runs a tight crew with little overtime gets less from the same robot.
Is the industry adopting cleaning robots yet?
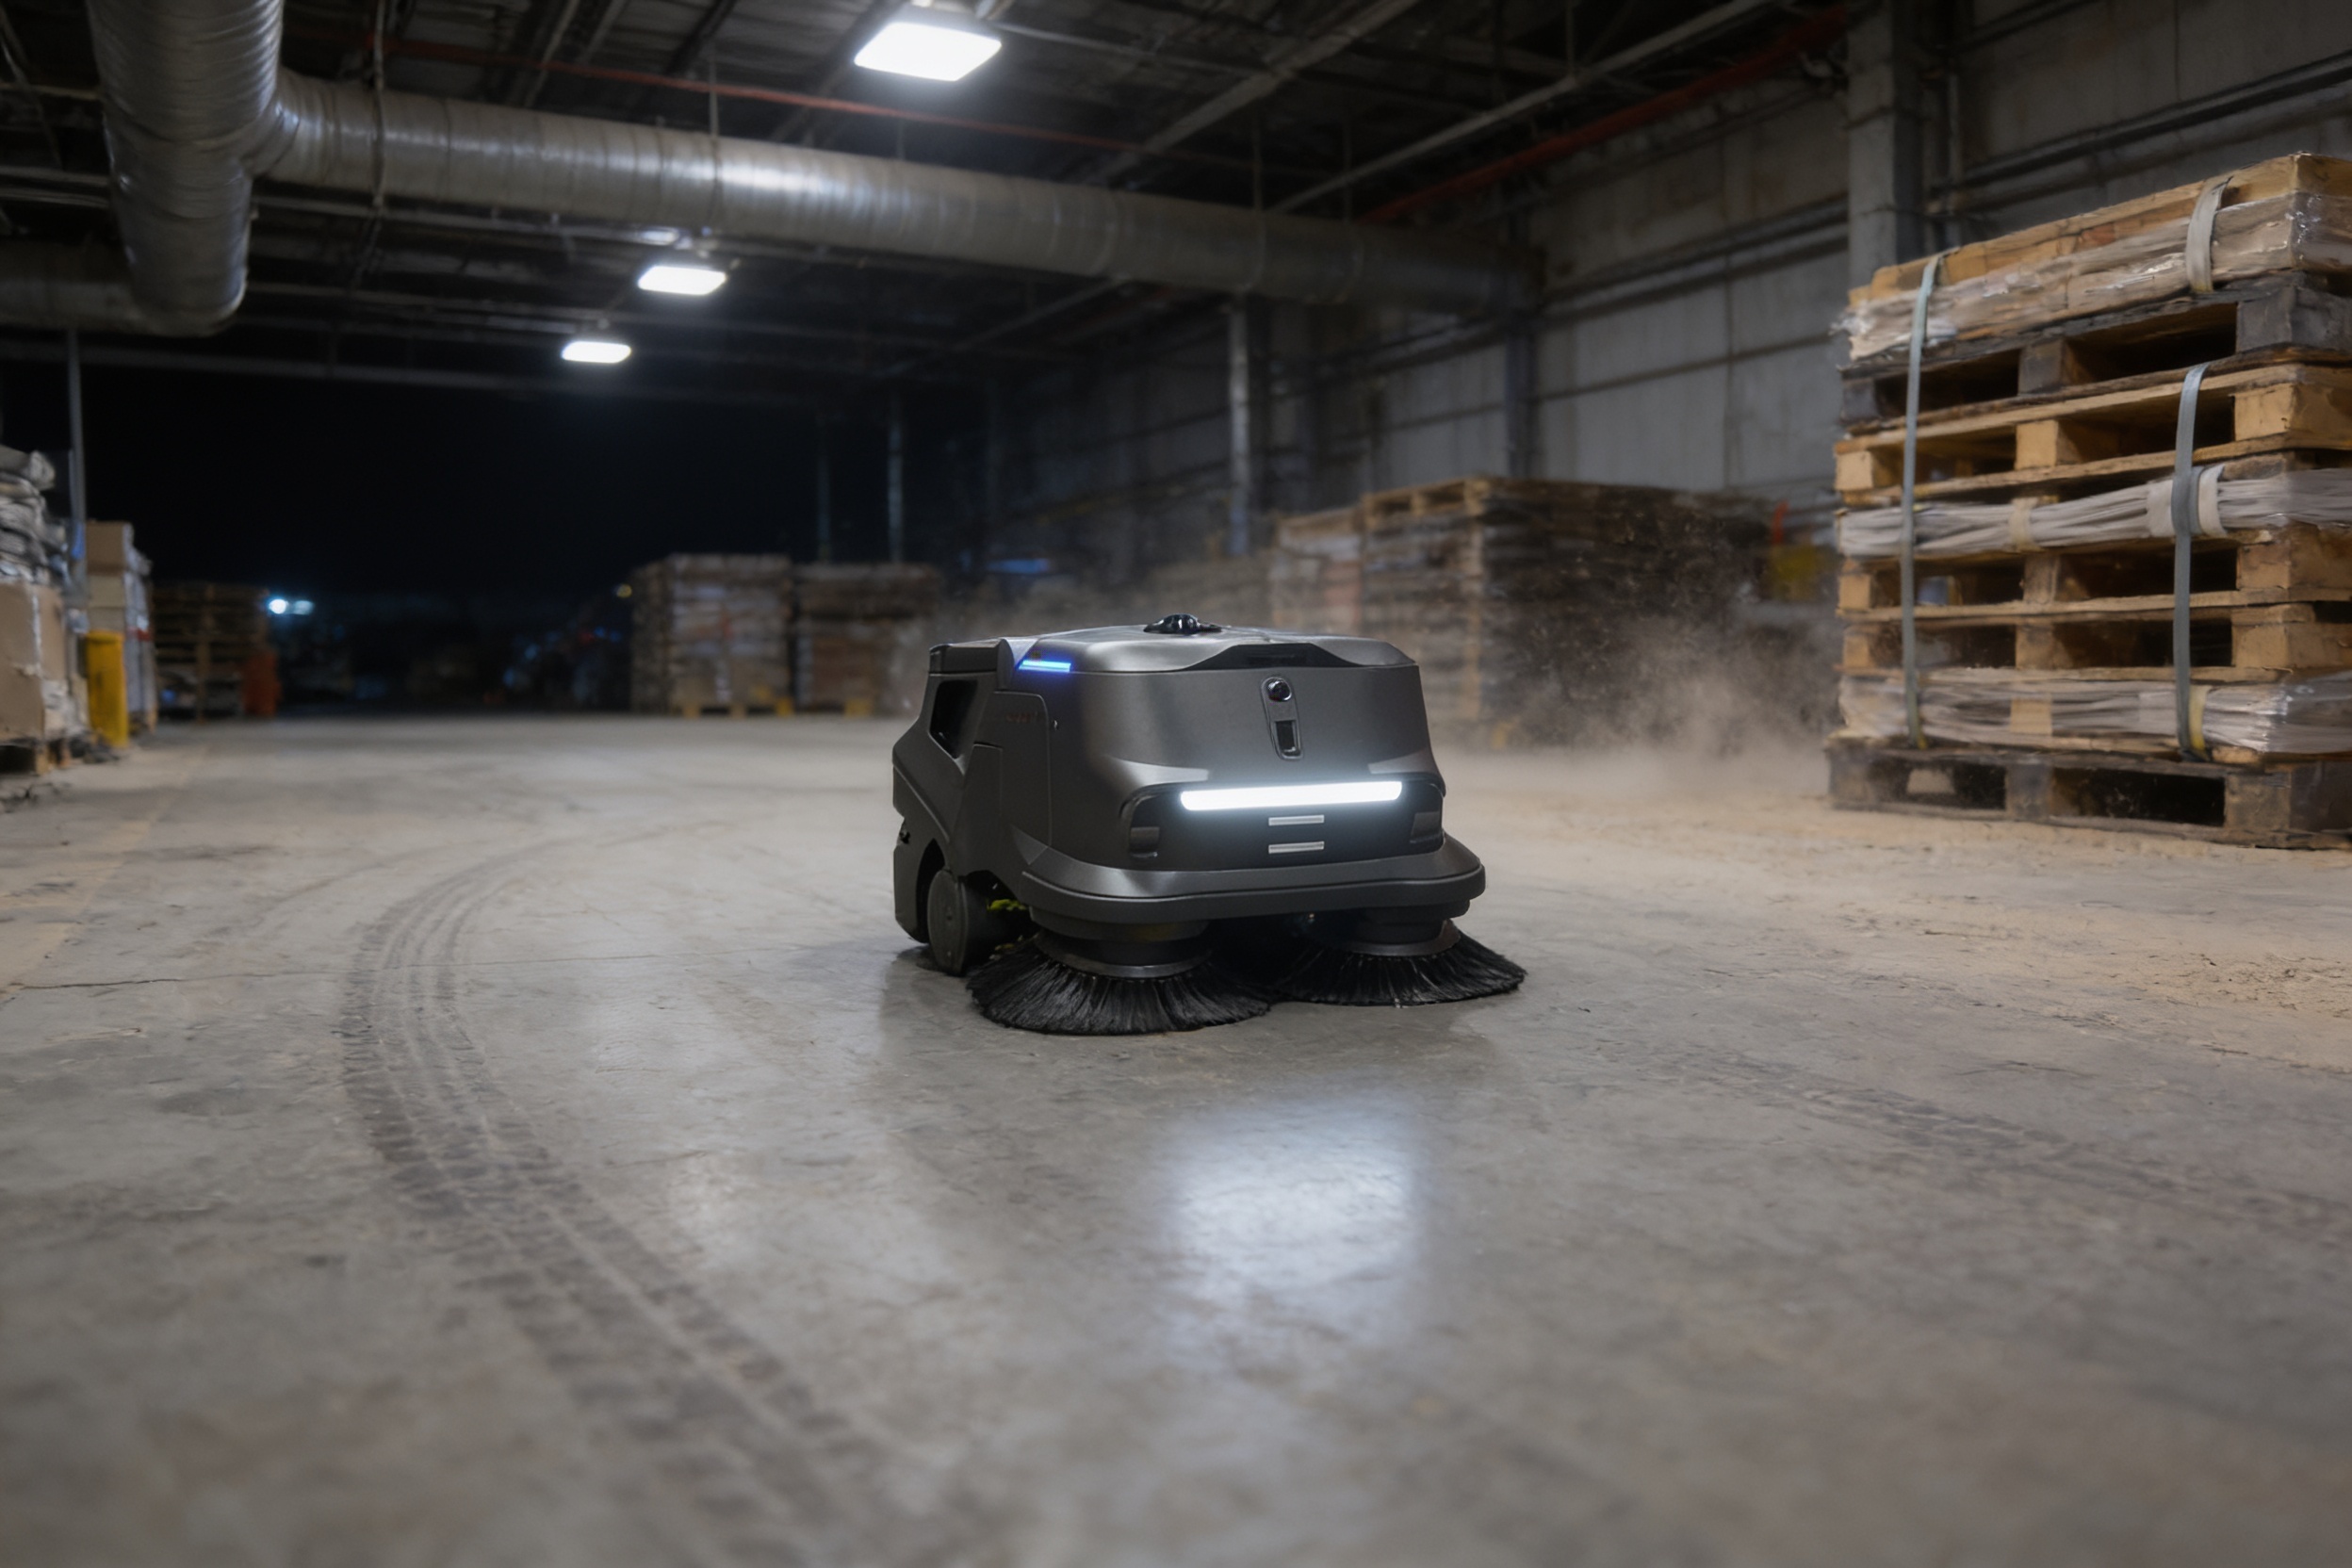
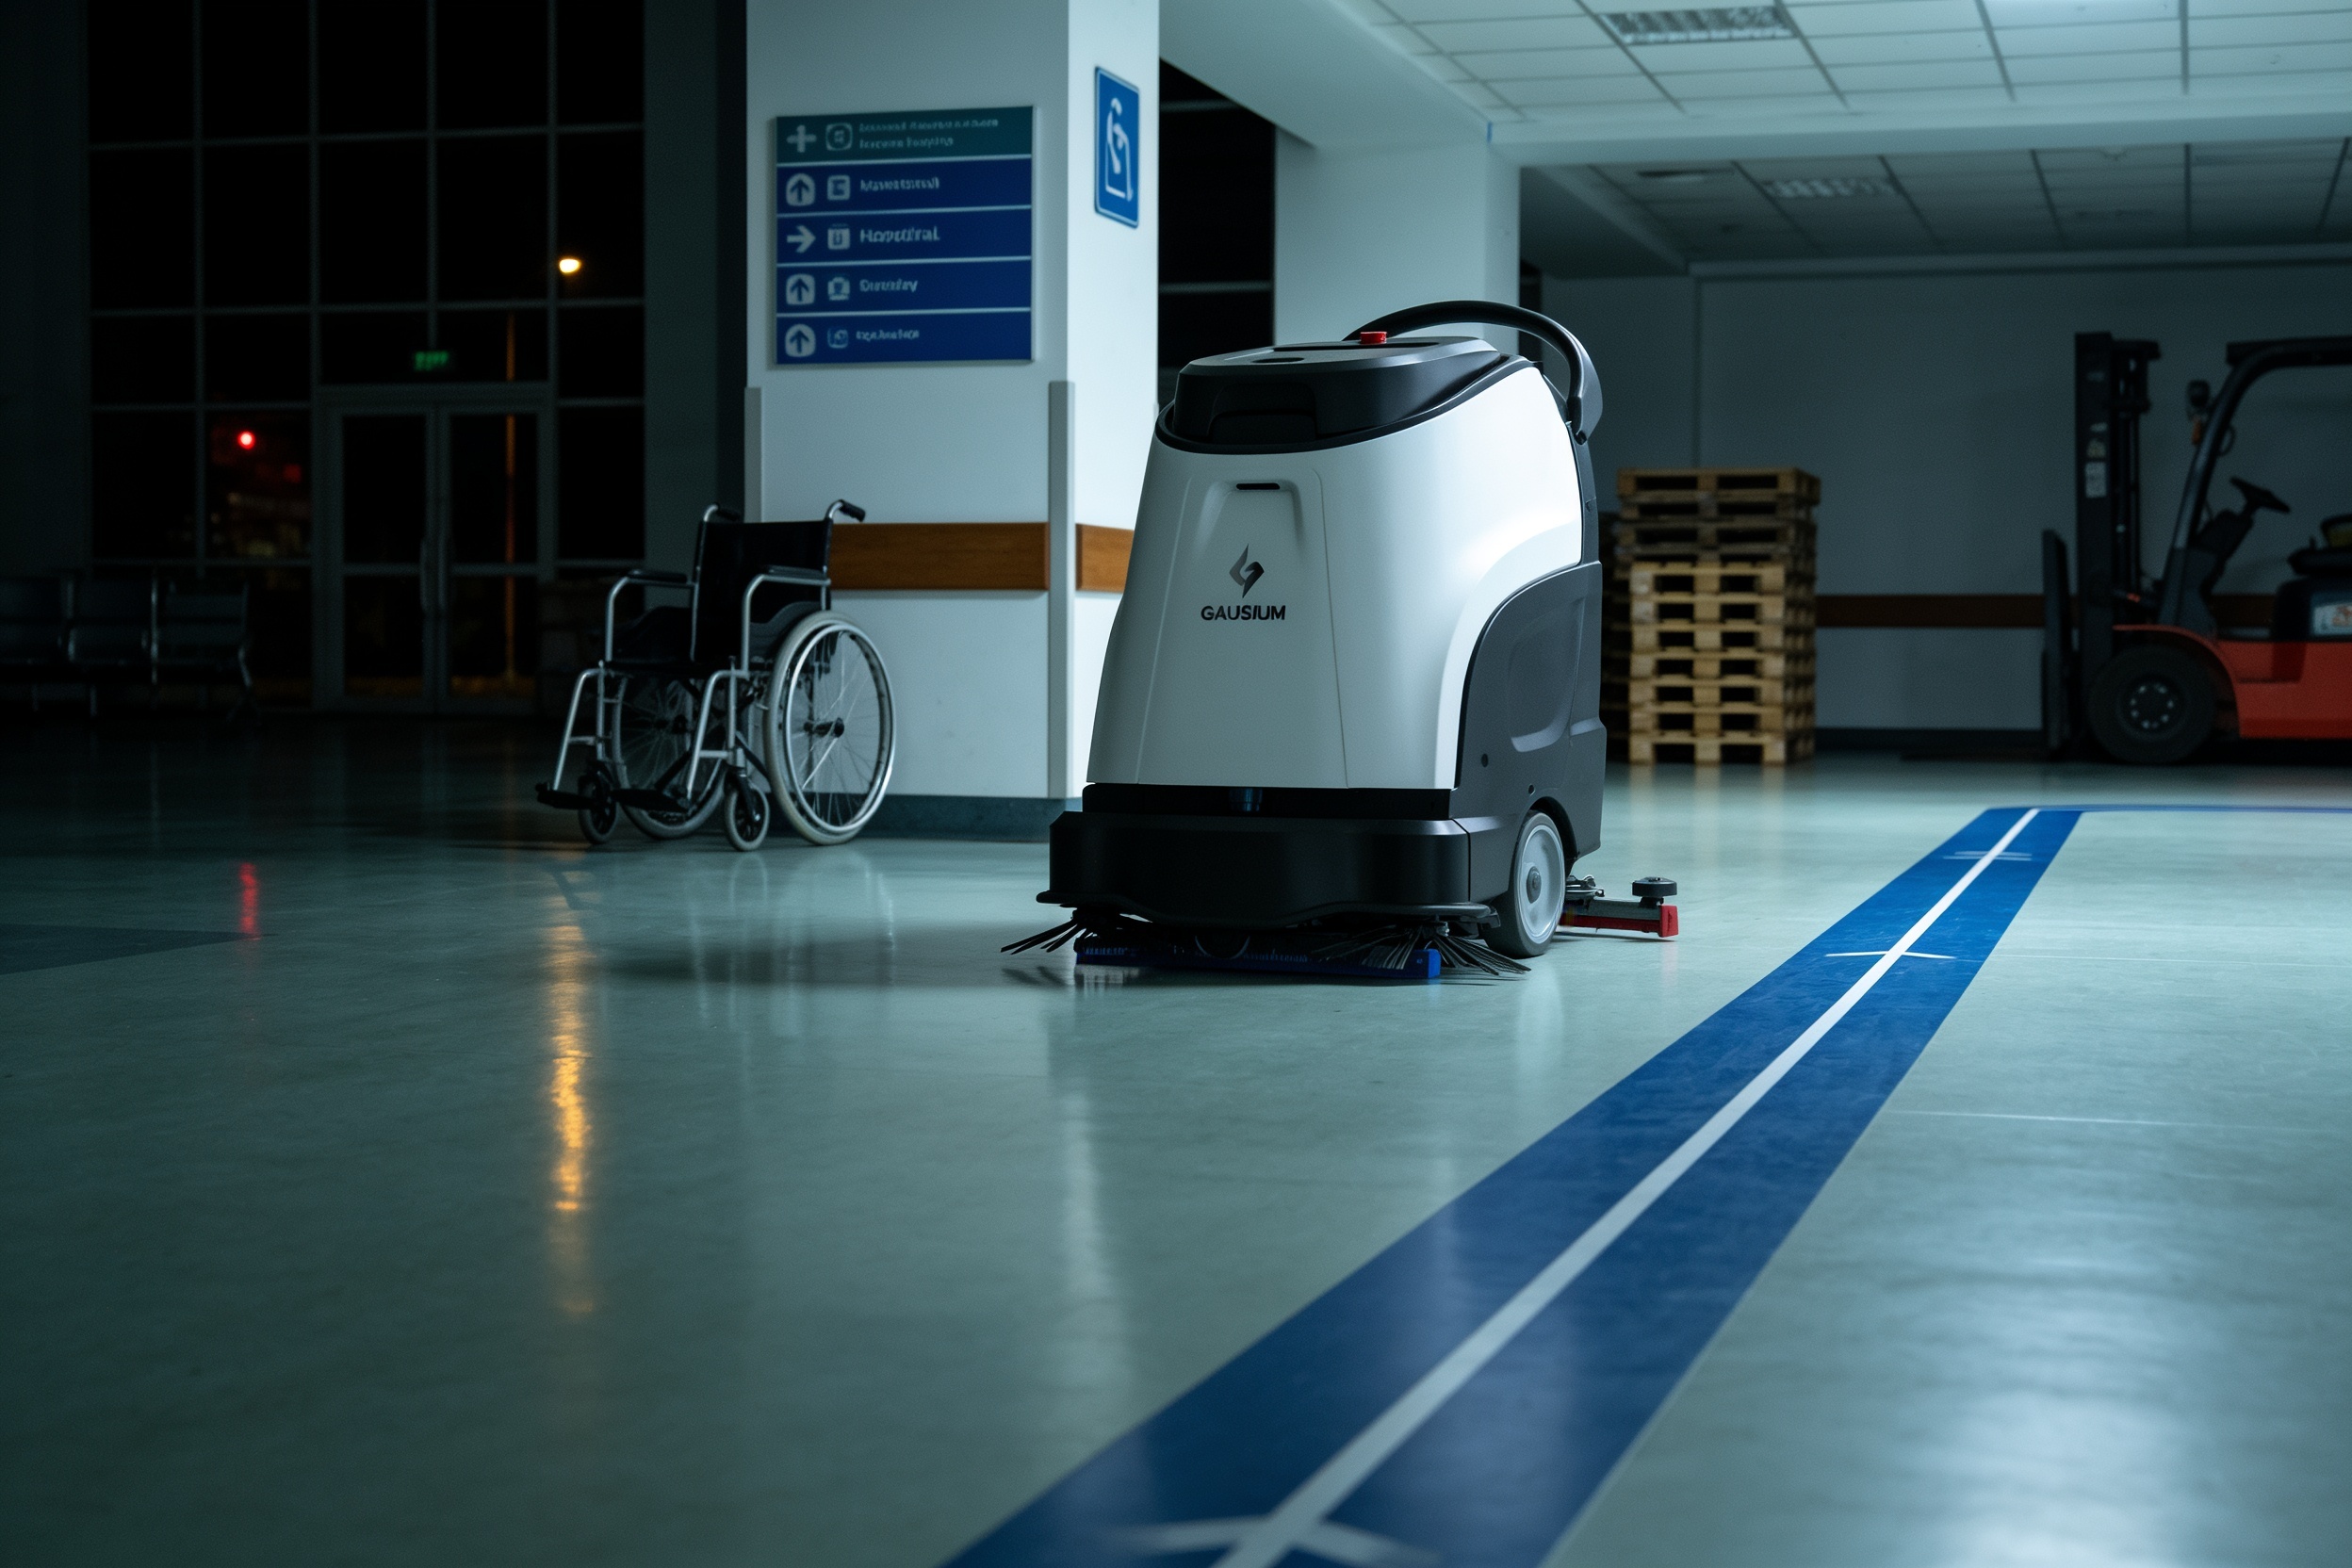
Adoption is early but moving. A 2019 survey by ISSA and AACEM went to nearly 23,000 building service contractors, in-house service providers, and facility or property managers. It found autonomous cleaning equipment adoption at an early stage, and about one-third of respondents who had not adopted said they were somewhat likely to adopt within the next year. The full report is limited to members, and the survey predates the newer signals below.
A 2026 vendor-issued press release says planned adoption of robotic floor equipment roughly doubled from 2025 to 2026, citing new cleaning-industry data. It gives no absolute percentages and comes from a seller, so read it as a direction and ask for the underlying data before relying on it.
ISSA Today reported that labor shortages and workforce development were a main agenda item at the 2025 ISSA Clean Advocacy Summit in Washington, D.C. That pressure sits behind much of the interest in automation. A robot does not solve staffing by itself, but it reduces how much of the schedule depends on filling every open shift.
How do turnover and injury rates affect the case?

Turnover is the input with the most conflicting numbers. A secondary statistics compilation citing ISSA reports 42 percent annual turnover for commercial cleaning staff. Other secondary sources report about 200 percent a year, or 150 to 200 percent, and none trace to a primary ISSA or BLS report. The BLS openings figure is an annual count of vacancies rather than a turnover rate, so measure turnover at your site from payroll records.
Injury data is more official. The BLS injury snapshot for janitors and cleaners, except maids and housekeeping cleaners, lists 18,680 nonfatal days-away cases in 2019, an incidence rate of 157.4 per 10,000 full-time equivalent workers. For 2020 it lists 21,100 cases and a rate of 191.6 per 10,000. The 2020 figure is the most recent verified here, and the snapshot does not explain the change.
The snapshot does not break out causes, so this page does not attribute any share of those cases to scrubbing or to other tasks a robot could take. A safety benefit is worth weighing in the decision, but keep it outside the savings range so the range stays a labor figure.
What are the risks to the return, and how do you avoid them?
The main risk is overstating the robot's share. If the plan assumes the robot takes restrooms, stairs and exceptions, the range falls apart early. Avoid it by mapping the floor and timing each task before the lease quote, and by writing down which tasks stay with staff.
The second risk is idle capacity. A robot that runs a route the building does not need, or on a schedule that conflicts with access, earns nothing. Confirm off-hour access, the route, and the docking spot in writing before deployment.
The third risk is a single point of failure. When a unit is out of service, the route falls back to staff, so the plan needs a service path. We service the robot nationwide. Ask what happens to the route when a unit is down and how quickly a service visit can reach your address.
The fourth risk is staff resistance. Staff who see the robot as a replacement may stop reporting problems. Train them to own the exceptions and make clear which parts of the work stay with people.
What is a realistic timeline from assessment to payback?
A realistic timeline runs in phases rather than on a single date. It starts with a site assessment that maps the floor and times the covered tasks. Next comes a lease quote through financing, then deployment and integration, staff training, and go-live support. The first weeks after go-live tune the route and the exception handling, which is when real covered hours appear in the data.
Payback is measured over the lease term, not from the first day. The savings range is only as good as the hours measured in the assessment, so the early operating period is the check on the math. Compare actual covered hours and avoided overtime against the range, and adjust the route or the staff plan if the gap is wide.
We pick the robot that fits the site, lease it through financing, deploy and integrate it, train the staff, and service it nationwide. The same team runs the assessment and the lease quote, so the payment is visible before any commitment.
How do you get a precise figure from a free site assessment?
The free site assessment replaces the range on this page with a figure for your building. It maps the floor, identifies reachable open area, times the tasks the robot would take, records existing staffing and the open shift pattern, and checks access and off-hour windows. Those inputs feed the same calculation described above.
Bring what you already have: the cleaning schedule, the number of people on each shift, overtime and vacancy records, floor plans, and the hours the building is open and accessible. The more of this you share, the less the assessment has to estimate.
The output is a savings range tied to your floor, a fixed robot lease payment quoted after the assessment, and a deployment plan. Many sites start with one unit on one area before expanding. Use the calculator on this page to test assumptions, then treat the assessment figure as the one to sign against.
Frequently asked questions
Put a robot to work in Grand Rapids.
We walk your site, learn the job, and recommend the unit that fits. Then we quote the lease, deploy it, and keep it serviced.
Sources
- US Bureau of Labor Statistics, Occupational Employment and Wage Statistics (OEWS May 2024)
- BLS Occupational Outlook Handbook, Janitors and Building Cleaners
- BLS injury and illness snapshot, janitors and cleaners except maids and housekeeping cleaners, 2016-20
- ISSA and AACEM autonomous cleaning survey, 2019
- ISSA Today, May-June 2025
- Vendor press release on robotic floor equipment adoption, 2026
- Secondary statistics compilation citing ISSA, commercial cleaning industry
- Business density aggregator citing Census County Business Patterns, 2023
- Census NAICS 561720 industry definition