
The short answer
Cleaning robot ROI in Greenville comes from the floor hours a robot takes over, valued at the local wage for this job, minus the fixed lease payment and the staff time the robot still needs. Only the share of the floor a robot covers reliably counts, so the result is a savings range rather than a single number. A free site assessment turns those inputs into a lease quote and a range built on measured hours.
Key takeaways
- Cleaning robot ROI in Greenville rests on floor hours taken over, valued at the local wage for this job.
- Only the share of the floor a robot covers reliably counts toward savings.
- Downtime, obstacles and slow service can erode the return more than the lease cost does.
- Adoption data is dated, so judge the case with measured hours from your own site.
- The lease quote and savings range come from a free site assessment, not from this page.
Run the numbers for your site
Auto-detected from your location - we use the real BLS wage here. Not right? Pick your city or state above.
What do you want to automate?
The robot runs the open floor overnight; your crew keeps detail and edges.
What does a cleaning robot return in Greenville?
Cleaning robot ROI in Greenville comes from one place: floor care hours that staff no longer have to work by hand. In this market those hours belong to janitors and building cleaners, the job the government wage data on this page covers for the Greenville area. A robot does not change what the floor needs. It changes who makes the repeat passes, when they happen, and how much of the shift is left for work that needs a person.
The return is a comparison between two costs. One is the labor value of the hours the robot takes over, priced at the local wage for this job. The other is the fixed lease payment for the unit and its service, plus whatever staff time the robot still uses. The gap between them is the savings range. It is an estimate, and it moves with the site, the shift pattern and how much of the floor the robot can cover without help.
Expect a range, not a promise. Two sites with the same floor area can land far apart, because one has a clear overnight window and the other has pallets in every aisle until morning. The rest of this page explains where those differences come from and how to measure them before anyone signs off.
Who does this work in Greenville, and how much floor care is there?
The Greenville-Anderson-Greer metro covers Anderson, Greenville, Laurens and Pickens counties. According to the Bureau of Labor Statistics regional release for May 2024, the largest occupational groups were office and administrative support at 12.2%, sales at 10.0% and production at 10.0%. The 2025 release reports 42,810 production jobs in the area, 10.0% of local employment, against a 5.7% national share. A large production base suggests many plants and distribution buildings with big floors that need daily care, although those BLS tables do not measure floor area directly.
The metro definition changed starting with the May 2024 release, so compare older local trends with care. WageDex, a third-party aggregator, reports about 6,250 workers in the metro under the janitors and cleaners classification, citing the May 2025 wage survey. That is not a BLS figure, so use it as a rough check against the government table, not as the basis for the math. We have not verified how many cleaners a typical site of this kind employs, so the calculator starts from a planning crew size until the assessment replaces it with your count.
Nationally, the Bureau of Labor Statistics counted 2,447,700 janitors and building cleaners in 2024 and projects 2% employment growth to 2034, which it calls slower than average. It projects about 351,300 openings a year on average, including replacement needs. Openings recur every year, so filling and training cleaning shifts is an ongoing task rather than a one-time hire.
Median hourly wage, Janitors and Building Cleaners
$3,236
Monthly cost of one full-time worker in Greenville, SC, at the median wage plus payroll costs (an estimate, not a quote).
How does the payback math work?
Start with the hours. Count the floor passes the robot can run unattended, such as long mapped routes on hard floors, and convert them into weekly hours. Price those hours at the local wage for this job from the panel beside this text. That labor value is the gross benefit before any costs are taken out.
Subtract what the robot costs to run. The lease payment is fixed and is set in a quote after a free site assessment, so it does not rise with the amount of work done. Subtract also the staff time the robot still needs, such as setup, route checks, emptying bins and cleaning sensors. What remains is net savings. Payback is the point where cumulative net savings cover what the deployment cost you, including training and the early weeks when the routine is still settling.
The calculator on this page runs this arithmetic with Greenville defaults and returns a range. Change one input at a time, such as the share of the floor covered or the staff time retained, and watch how far the result moves. The input you can least afford to guess is the share of the work the robot can actually take, which is the subject of the next section.
How much of the work can a robot realistically take?
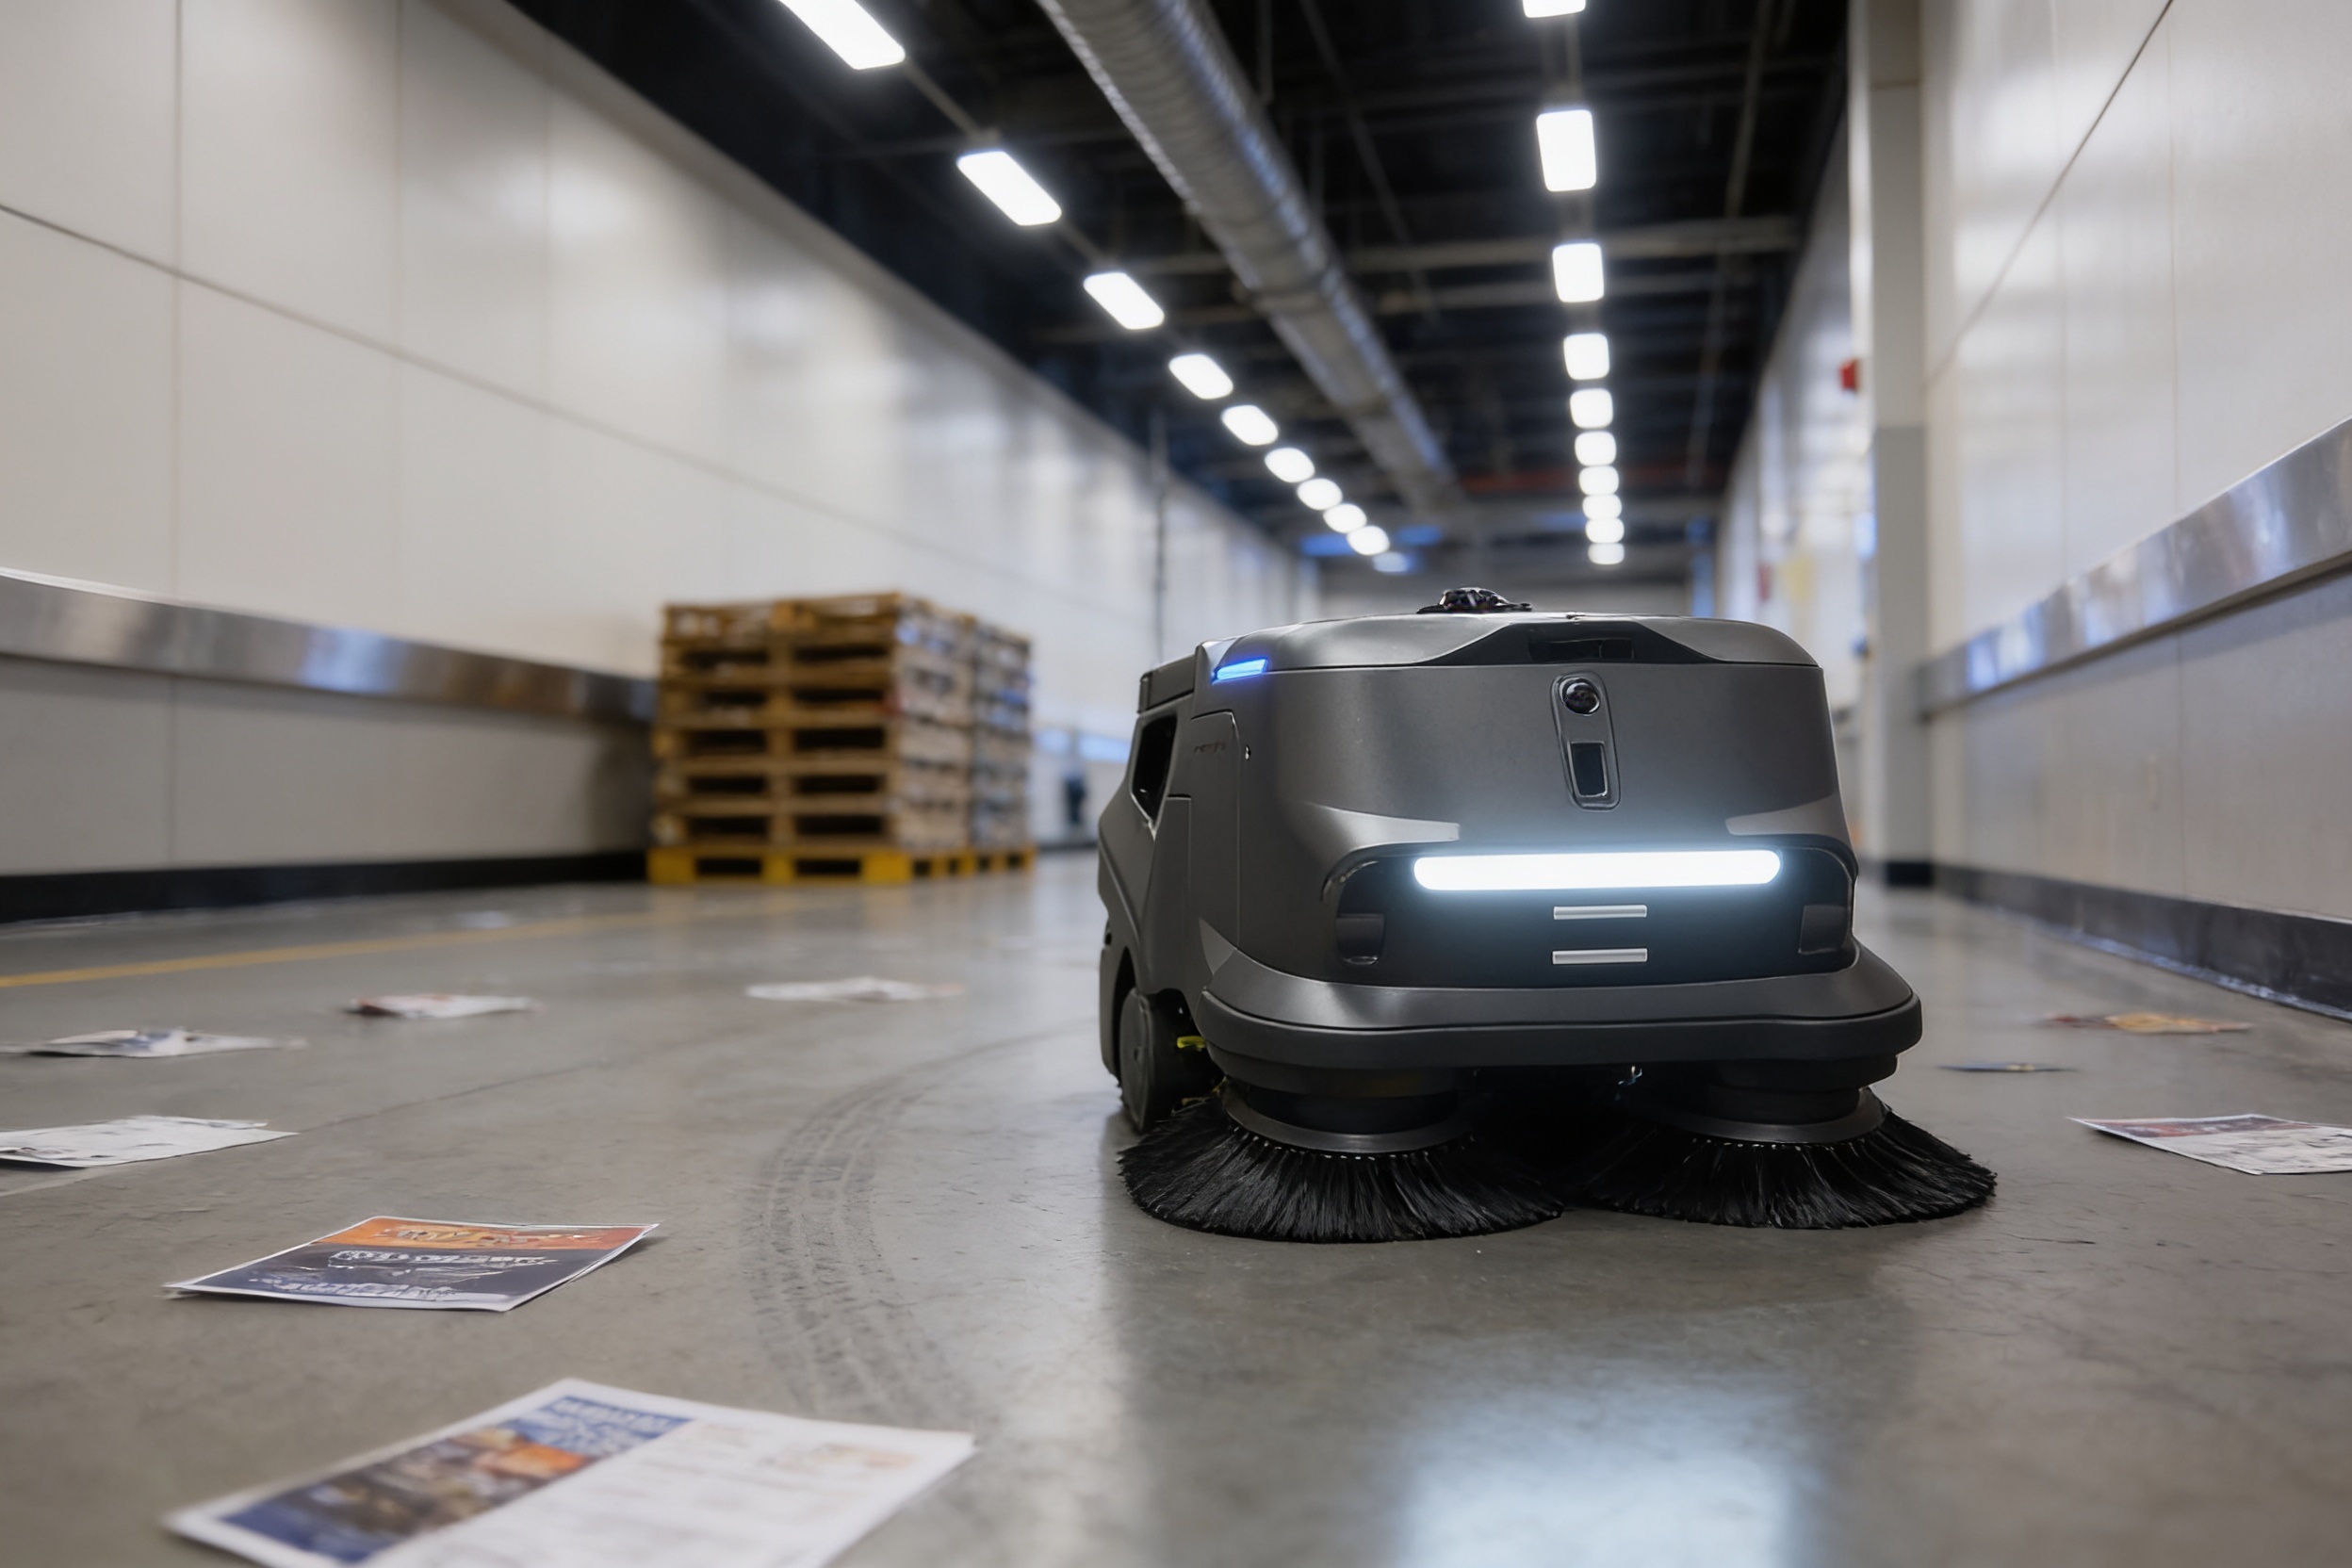
Not all of it. A floor scrubber does well on long, open, repeatable passes over hard floors. It struggles with clutter, pallets left in aisles, loose cords, raised thresholds and tight corners. Restrooms, trash, spills and detail work still need people. The realistic share is the part of the schedule that is repeat floor care on routes that are mapped and clear, and that is the number most worth testing in an assessment.
Count hours by task, not by headcount. A cleaner who spends part of a shift on floors and the rest on everything else is not a full-time floor cleaner, so the robot should be credited only for the floor hours it replaces. The table below breaks the work down task by task. It uses descriptions rather than hour counts on purpose, because we have not verified typical shift hours or floor area for this kind of site, and the assessment measures your own timings.
Keep an honest margin. A robot that covers its route on most nights but sits idle on the nights a pallet blocks the aisle is worth less than its best night suggests. Model the blocked nights, the downtime and the exceptions staff will still handle, then compare the result with the hours in your records. A conservative share that holds up is more useful than an optimistic one that falls apart in the second month.
What changes the number up or down?
The biggest levers are the size and shape of the floor, the hours it sits idle, and how clean the route is. Large open floors with few obstacles and a clear overnight window return more than small, broken-up rooms. A site that runs floor care on a fixed night shift gets more from an unattended robot than one where floors are cleaned in short bursts all day, because the robot's hours can replace staff hours directly.
Labor cost and turnover matter next. The local wage for this job sets the value of each hour, and the government table on this page is the starting point. Turnover adds costs that rarely show on a payroll line, including recruiting, training and the overtime that covers an open shift. Published turnover figures for this industry are mostly vendor-reported and vary widely, so your own vacancy and overtime records are the better guide.
Lease terms and service coverage move the result too. Downtime, slow repair response and spare units all change how many hours the robot really delivers. A quote that states response expectations in writing is easier to model than one that does not.
What are the risks to the return, and how do you avoid them?
The first risk is overstating coverage. If the model assumes the robot runs every night and the aisles are blocked on several of them, the savings range will be too high. Plan for downtime, sensor cleaning and exceptions, and make the model reflect how the site actually runs. Ask that the quote state how service response works, because a unit that waits days for a repair does not cover its hours.
Safety is the second risk, and it cuts both ways. According to the Bureau of Labor Statistics injury snapshot for janitors and cleaners, the 2016 to 2020 average was 191.6 cases per 10,000 full-time equivalent workers. Those are days-away cases, not total recordables, and they show how physical this work is. Removing repetitive floor passes can reduce exposure to that work, but a robot in a busy aisle creates its own hazard. The deployment plan should set marked routes, traffic rules and a clear stop procedure.
Turnover is the third risk. A janitorial industry blog says it draws on BLS data without naming the series, and reports average annual total separations near 45% from 2017 onward, excluding 2020. Treat that as a vendor-reported signal, not a local measurement. Check your own separations and vacancy records before deciding how much turnover should count in the model.

How common is cleaning automation in facilities like these?
Adoption is still early, and the most cited survey is dated. A survey by ISSA with AACEM reached about 23,000 building service contractors, in-house providers and facility managers. It found that 27% of respondents were active users of autonomous cleaning equipment. Because the survey is several years old, read it as an early picture rather than today's share. About one-third of respondents who had not adopted said they were likely to within a year.
Vendors and blogs often cite higher figures, but many draw on their own customers or on older data. A more useful test is local. Ask whether comparable floors in the metro already run unattended scrubbers, and what those operators measured. Ask any provider for results from floors of a similar type and size, and check whether those results came from the same kind of building.
Access to equipment is not the same as fit. Plenty of facilities can use the technology but lack an overnight window or a layout the robot can run. The comparison below sets the robot against a person honestly, including the tasks where the person clearly wins.
- Night coverage
Cleaning Robot
Runs an unattended mapped route after close, when the floor is empty
Staff
Needs a shift, wages and a supervisor for every hour worked
- Repeat passes
Cleaning Robot
Follows the same route and pass count on every run
Staff
Quality drifts with fatigue and staffing levels
- Spills and odd jobs
Cleaning Robot
Cannot respond to a spill it was not set up to detect
Staff
Handles spills, debris and unexpected problems on the spot
- Restrooms and detail work
Cleaning Robot
Outside its job
Staff
Strong here, with judgment about surfaces and fixtures
- Flexibility
Cleaning Robot
Works within a mapped layout, so layout changes need remapping
Staff
Adapts to rearranged rooms and one-off requests
- Continuity
Cleaning Robot
Needs service and repair, with a backup plan for downtime
Staff
Absences and turnover create gaps that need cover
What is the timeline from assessment to payback?
A typical path starts with a free site assessment, which maps the floor and measures existing hours by task. The result is a lease quote and a savings range built on those hours. If the numbers hold up, deployment follows, with the route mapped, staff trained and go live support on site. The early weeks are the slowest part of the return, because staff are learning the routine and the robot is being tuned to the floor.
Payback arrives once steady operation is reached and the hours taken over repeat reliably. Avoid any promise of a date before the assessment, because the date depends on how fast the route is mapped, how clear the overnight window is and how quickly exceptions get resolved. Sites with a stable floor and a clear night reach steady operation sooner than sites that need layout changes first.
A pilot on one floor or one building can show measured hours before a wider rollout. That keeps the decision tied to your own records rather than to projections, and it gives staff time to adjust. A pilot is a good way to test the share of work the robot takes before committing to a larger deployment.
How do you get an exact figure from a free site assessment?
Request the assessment with your existing cleaning schedule, floor areas by zone, overnight access rules and notes on obstacles, service contracts and vacancies. We pick the right robot for the site, lease it through financing, deploy and integrate it, train staff and service it nationwide. The assessment is where the savings range becomes a number you can check.
The quote states the fixed lease payment, the service terms and the coverage the robot is expected to deliver, so you can compare it directly with the labor hours in your records. Use the calculator on this page for a first range, then replace its planning assumptions with the assessment data. A range built from measured hours is worth far more than one built from general averages.
Bring the people who sign off on the decision and the staff who know the floor. Night supervisors often know where aisles block and which days run late, and that knowledge shapes the realistic share more than any table can. A cleaning robot ROI in Greenville that holds up is one the site team helped test.
Frequently asked questions
Put a robot to work in Greenville.
We walk your site, learn the job, and recommend the unit that fits. Then we quote the lease, deploy it, and keep it serviced.
Sources
- US Bureau of Labor Statistics, Occupational Employment and Wage Statistics (OEWS May 2024)
- Bureau of Labor Statistics, Occupational Employment and Wages, Greenville-Anderson-Greer, May 2024
- Bureau of Labor Statistics, Occupational Employment and Wages, Greenville-Anderson-Greer, 2025 release
- Bureau of Labor Statistics, Occupational Outlook Handbook, Janitors and Building Cleaners
- Bureau of Labor Statistics, Injury and Illness Snapshot, Janitors and Cleaners, 2016 to 2020
- WageDex, Janitors and Cleaners, Greenville-Anderson-Greer metro (third-party)
- Janitorial industry blog on turnover (vendor-reported)
- ISSA autonomous cleaning survey
- ISSA autonomous cleaning survey, related page