
The short answer
A business in Indianapolis can expect cleaning robot ROI to come from the floor hours a leased robot takes over from janitors and building cleaners, minus the lease cost and the time staff spend on setup and checks. The savings range depends on how much open hard floor the robot can cover, how many crew hours that floor takes today, and how much of the job stays with people. A free site assessment turns those inputs into a savings range and a fixed robot lease payment quote for your building.
Key takeaways
- The return comes from floor hours the robot takes over, valued with the local wage on this page.
- Open, hard, repeatable floors deliver the most hours, while carpet, stairs and clutter deliver the least.
- Count the share of work a robot realistically covers, not the whole job.
- Setup, mapping and daily checks cut into early gains, so plan for them from the start.
- A free site assessment turns the range into a lease quote for your building.
Run the numbers for your site
Auto-detected from your location - we use the real BLS wage here. Not right? Pick your city or state above.
What do you want to automate?
The robot runs the open floor overnight; your crew keeps detail and edges.
Cleaning robot ROI in Indianapolis: where the return comes from
For a business in Indianapolis, the return on a cleaning robot comes from floor hours. A robot that scrubs or sweeps a fixed route takes that work off the crew's schedule, so the labor hours it displaces are the first input. Lease cost, the daily route check and the time spent on setup are then subtracted from that value.
The return is strongest where the work is steady: large hard floors, fixed routes and cleaning that can run when the building is empty. Consistency also has value. A robot runs the same route on the same schedule, so coverage does not slip when a shift is short. That benefit is real but harder to price, so the core math on this page is built on hours.
Adoption context helps frame the decision. According to BSM Magazine, floor-cleaning robots were about 42 percent of a 2024 robotics market, but that figure is a market research estimate, not a count of facilities. A 2019 AACEM and ISSA survey found that about a third of non-adopters said they were somewhat likely to acquire autonomous equipment within a year.
How many people do this work, and what does the public data show?
According to the Bureau of Labor Statistics Occupational Outlook Handbook, employment of janitors and building cleaners was about 2.4 million jobs in 2024, with projected growth of 2 percent from 2024 to 2034. The same source projects about 351,300 openings a year. Those openings combine growth with replacement of workers who leave, so they signal churn in the occupation rather than a turnover rate for any one employer. We did not find a verified turnover rate for this job in the BLS data.
The government wage data on this page is the local input for the labor side of the math. Use it as the value of an hour of this kind of work, then apply it to the hours your crew spends on floor routes a robot can run. Public data does not break out cleaning robot adoption or staffing by metro, so the Indianapolis figures that matter come from your own timesheets and the wage panel.
Our research did not produce a verified count of people doing this work at one site, so the headcount on this page is a floor of one. The site assessment sets the real number, which depends on building size, shift pattern and how the work is split between people and equipment.
Injury exposure is part of the picture. According to the Bureau of Labor Statistics, cases with days away from work for janitors and cleaners, excluding maids and housekeeping cleaners, were 191.6 per 10,000 full-time equivalent workers in 2020. Rates for 2016 to 2018 ranged from 137.1 to 178.6 in the BLS series covering 2016 to 2020, and according to the BLS snapshot covering 2015 to 2019, the 2019 rate was 157.4 across 18,680 cases. A robot will not change that rate on its own, so decide early which tasks stay with people.
Median hourly wage, Janitors and Building Cleaners
$4,006
Monthly cost of one full-time worker in Indianapolis, IN, at the median wage plus payroll costs (an estimate, not a quote).
How many floor hours does a robot really take over?
The coverage rate sets the hours. According to an ISSA-based benchmark published in a vendor hosted sample cleaning times report, an automatic 17-inch walk-behind scrubber covers 5,917 square feet per hour, while manual mopping covers 1,667 square feet per hour. That benchmark dates from 2009 and describes a scrubber rather than a modern robot, but it shows the scale of the gap. The same 10,000 square feet takes about six hours to mop by hand and under two hours of machine time at the scrubber rate.
Treat any vendor rate as a ceiling until a site test confirms it. Real throughput falls when routes are broken up by racking, pallets, tables and chairs. One online warehouse cleaning calculator adds a default 20 percent obstruction allowance for a standard racked warehouse. Applying that same allowance to the machine time above moves the figure from under two hours to about two hours per 10,000 square feet.
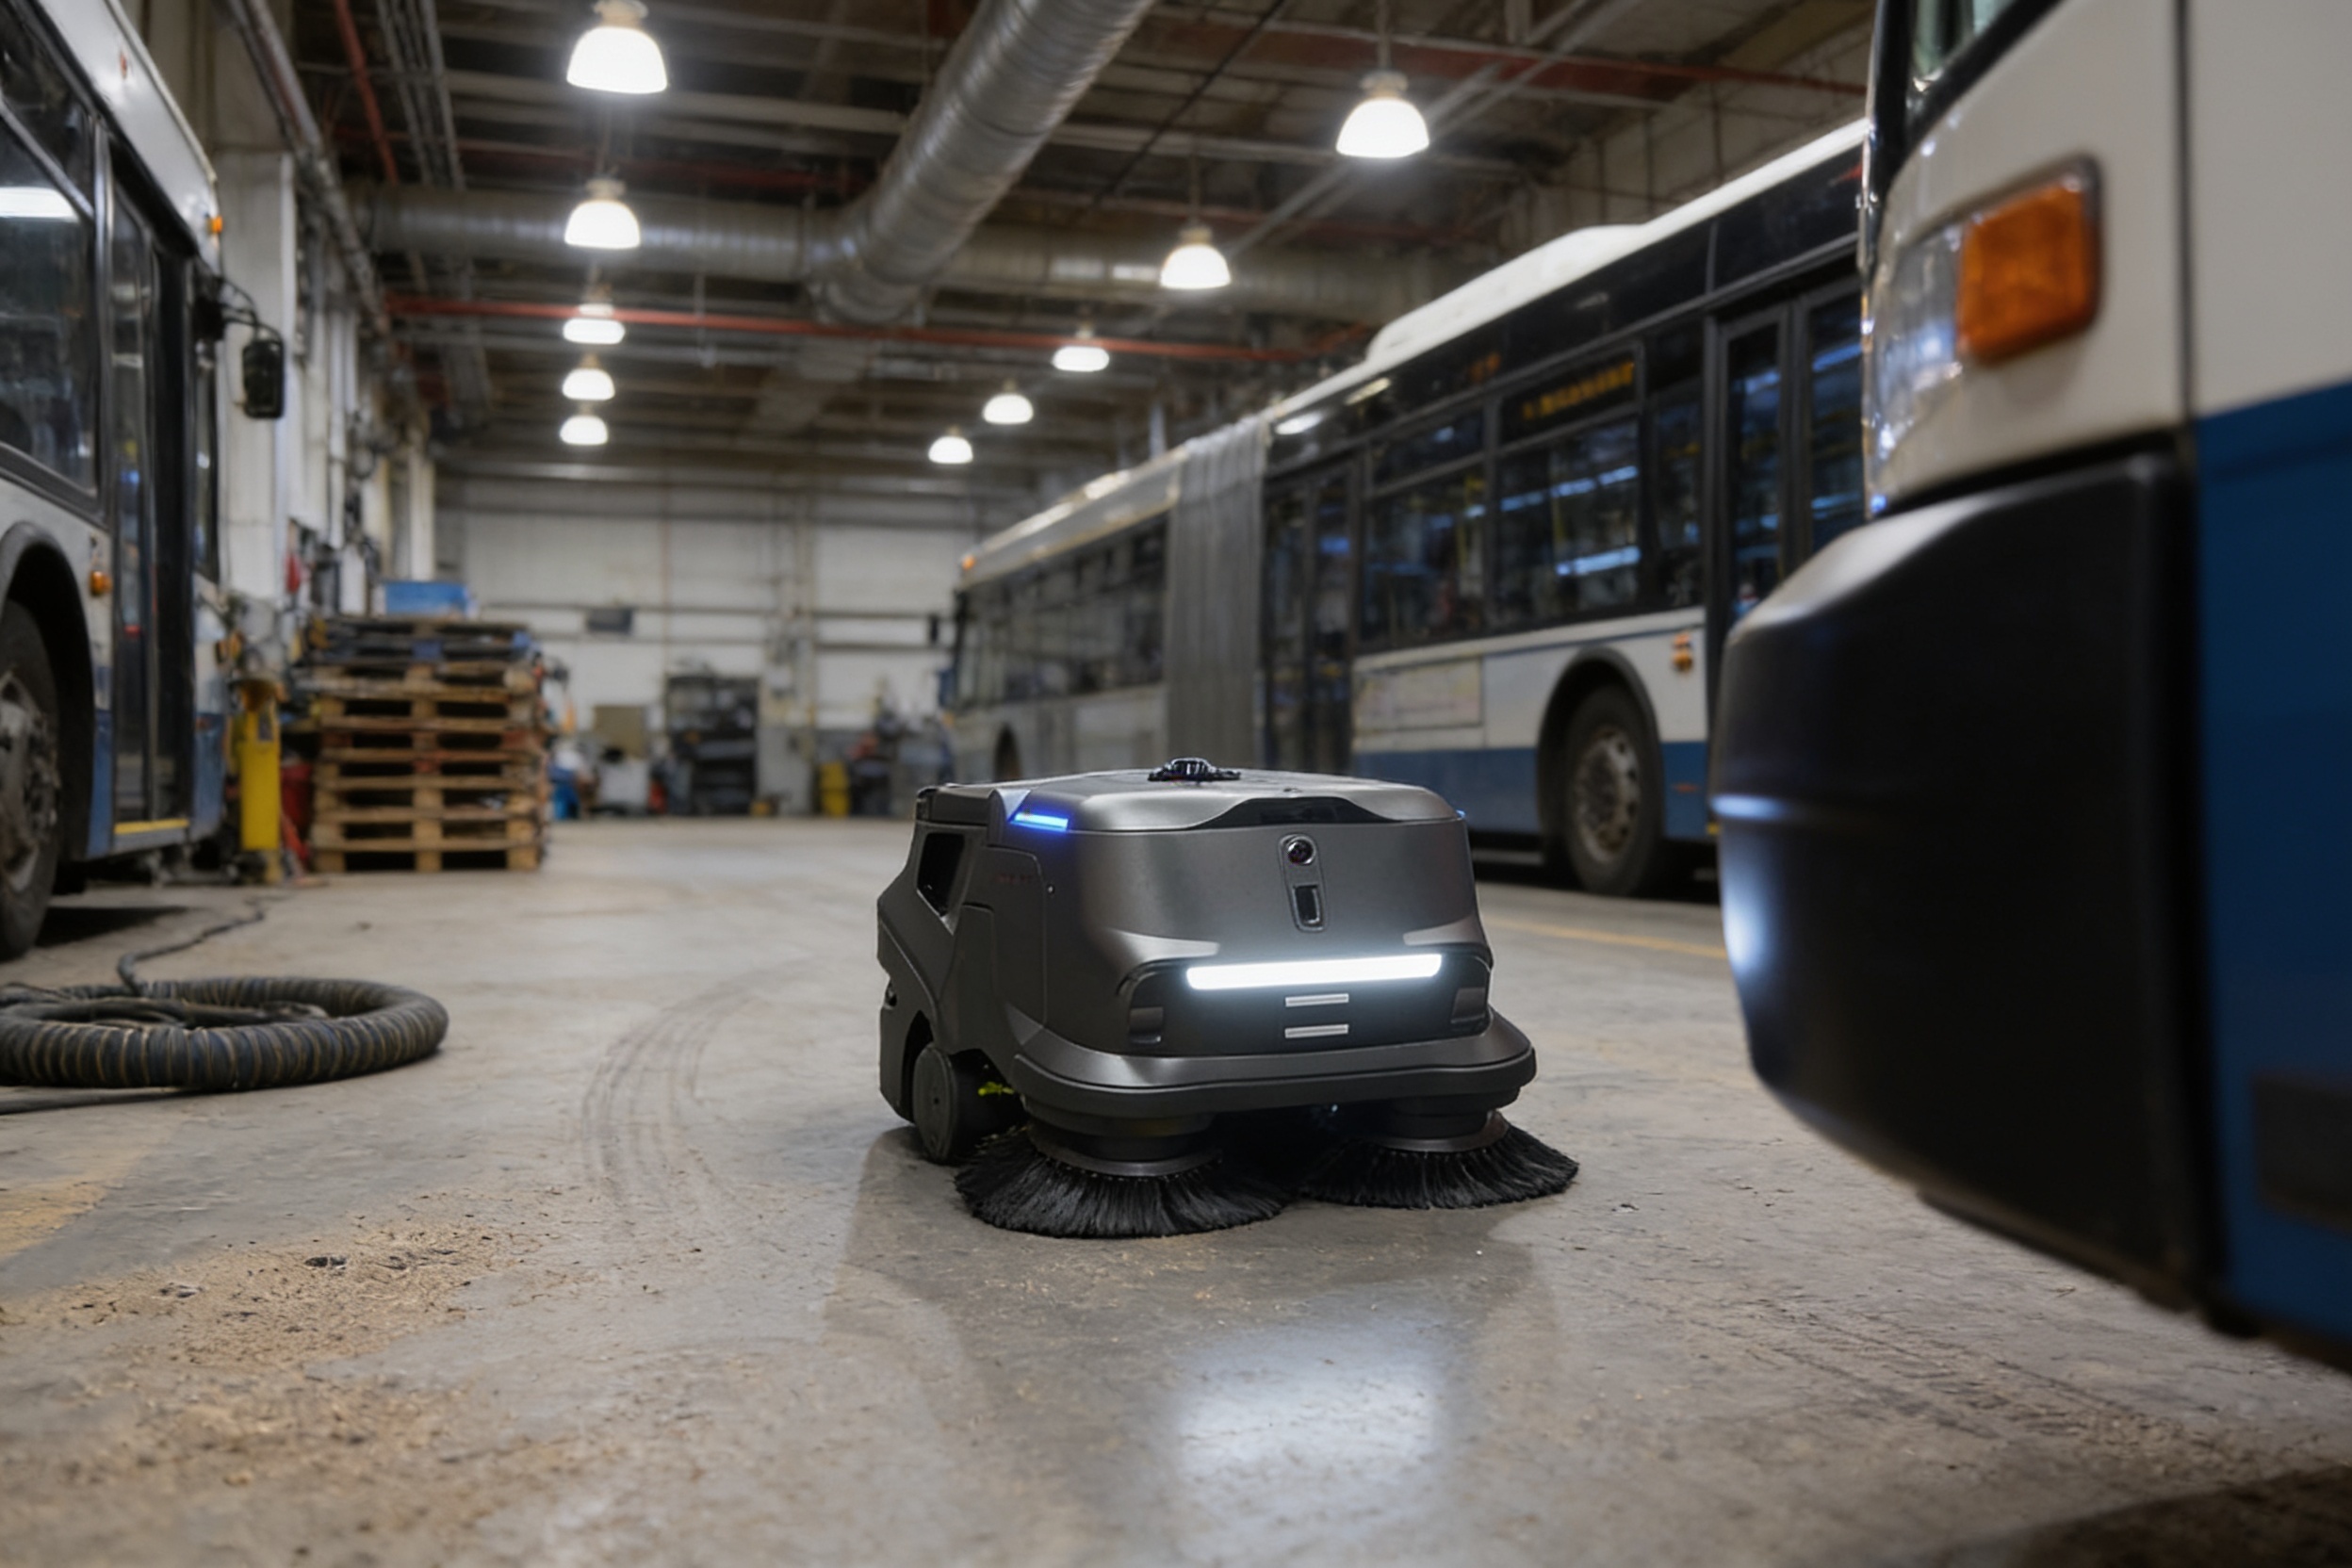
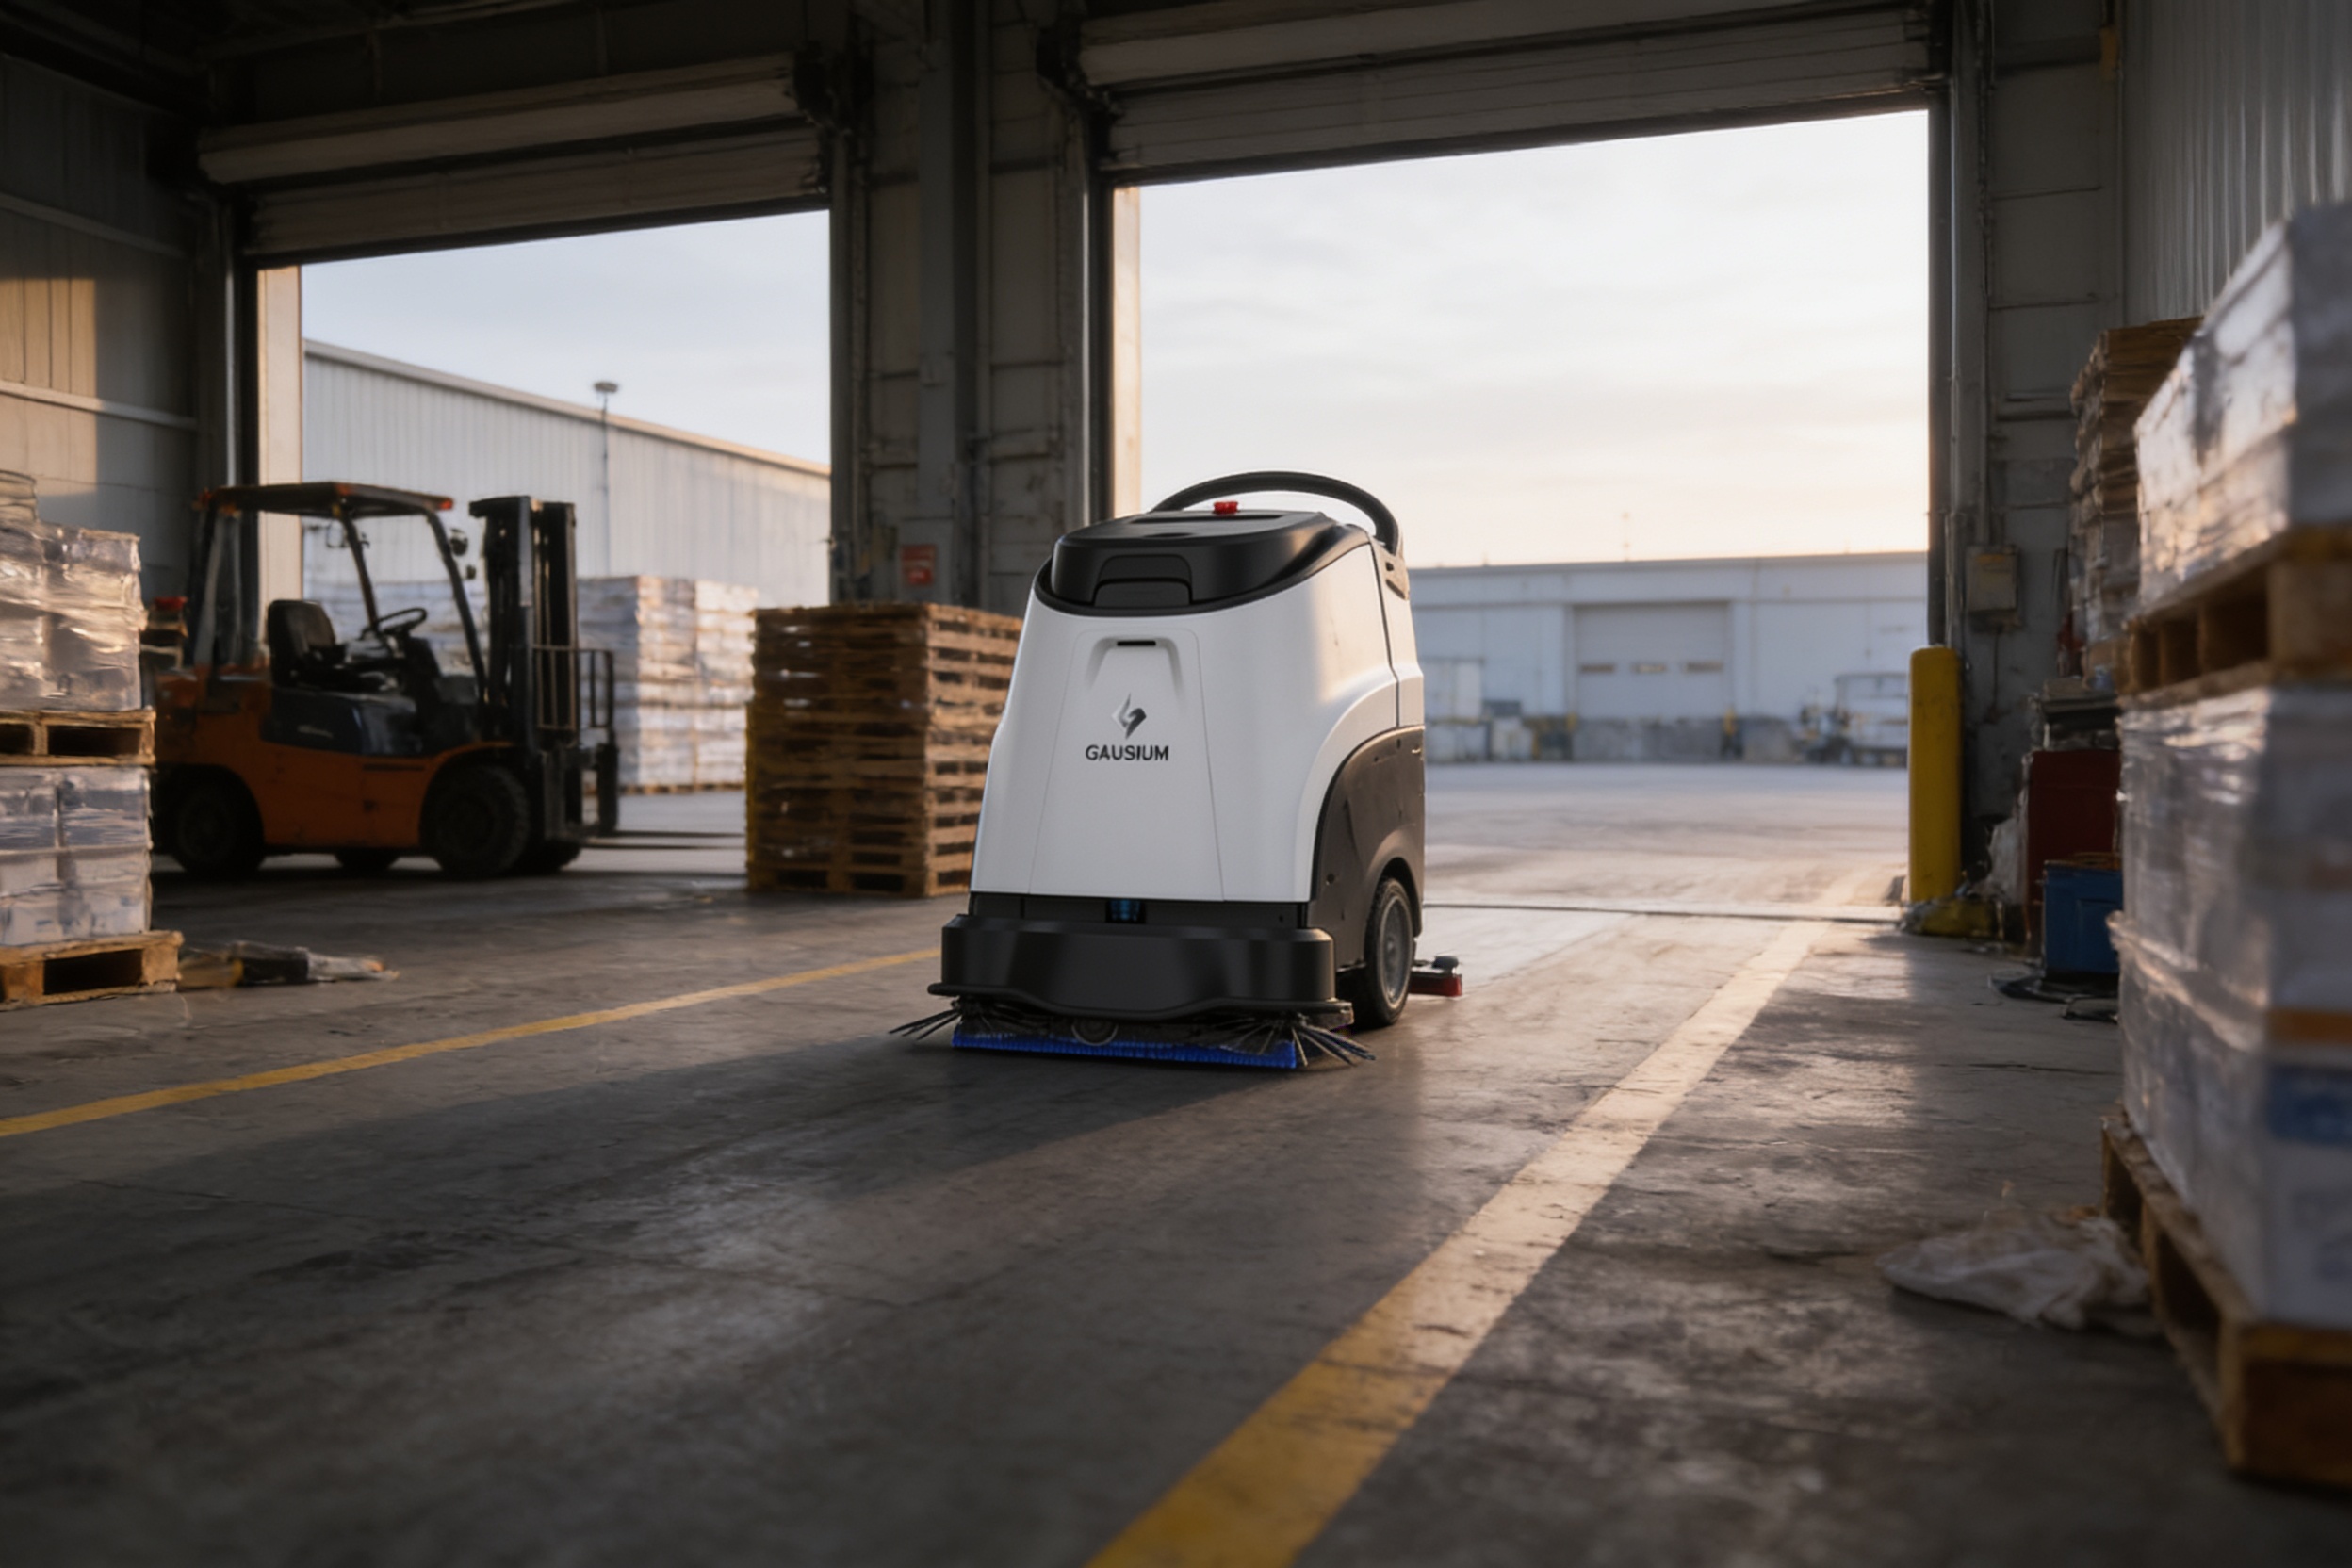
The robot takes the open floor passes, not the whole job. Restrooms, detail work, spills and stairs usually stay with people. The hours it takes over are the route time on open hard floor, minus the time to check, load and clear each route before a run.
Which areas of the building does the robot cover?
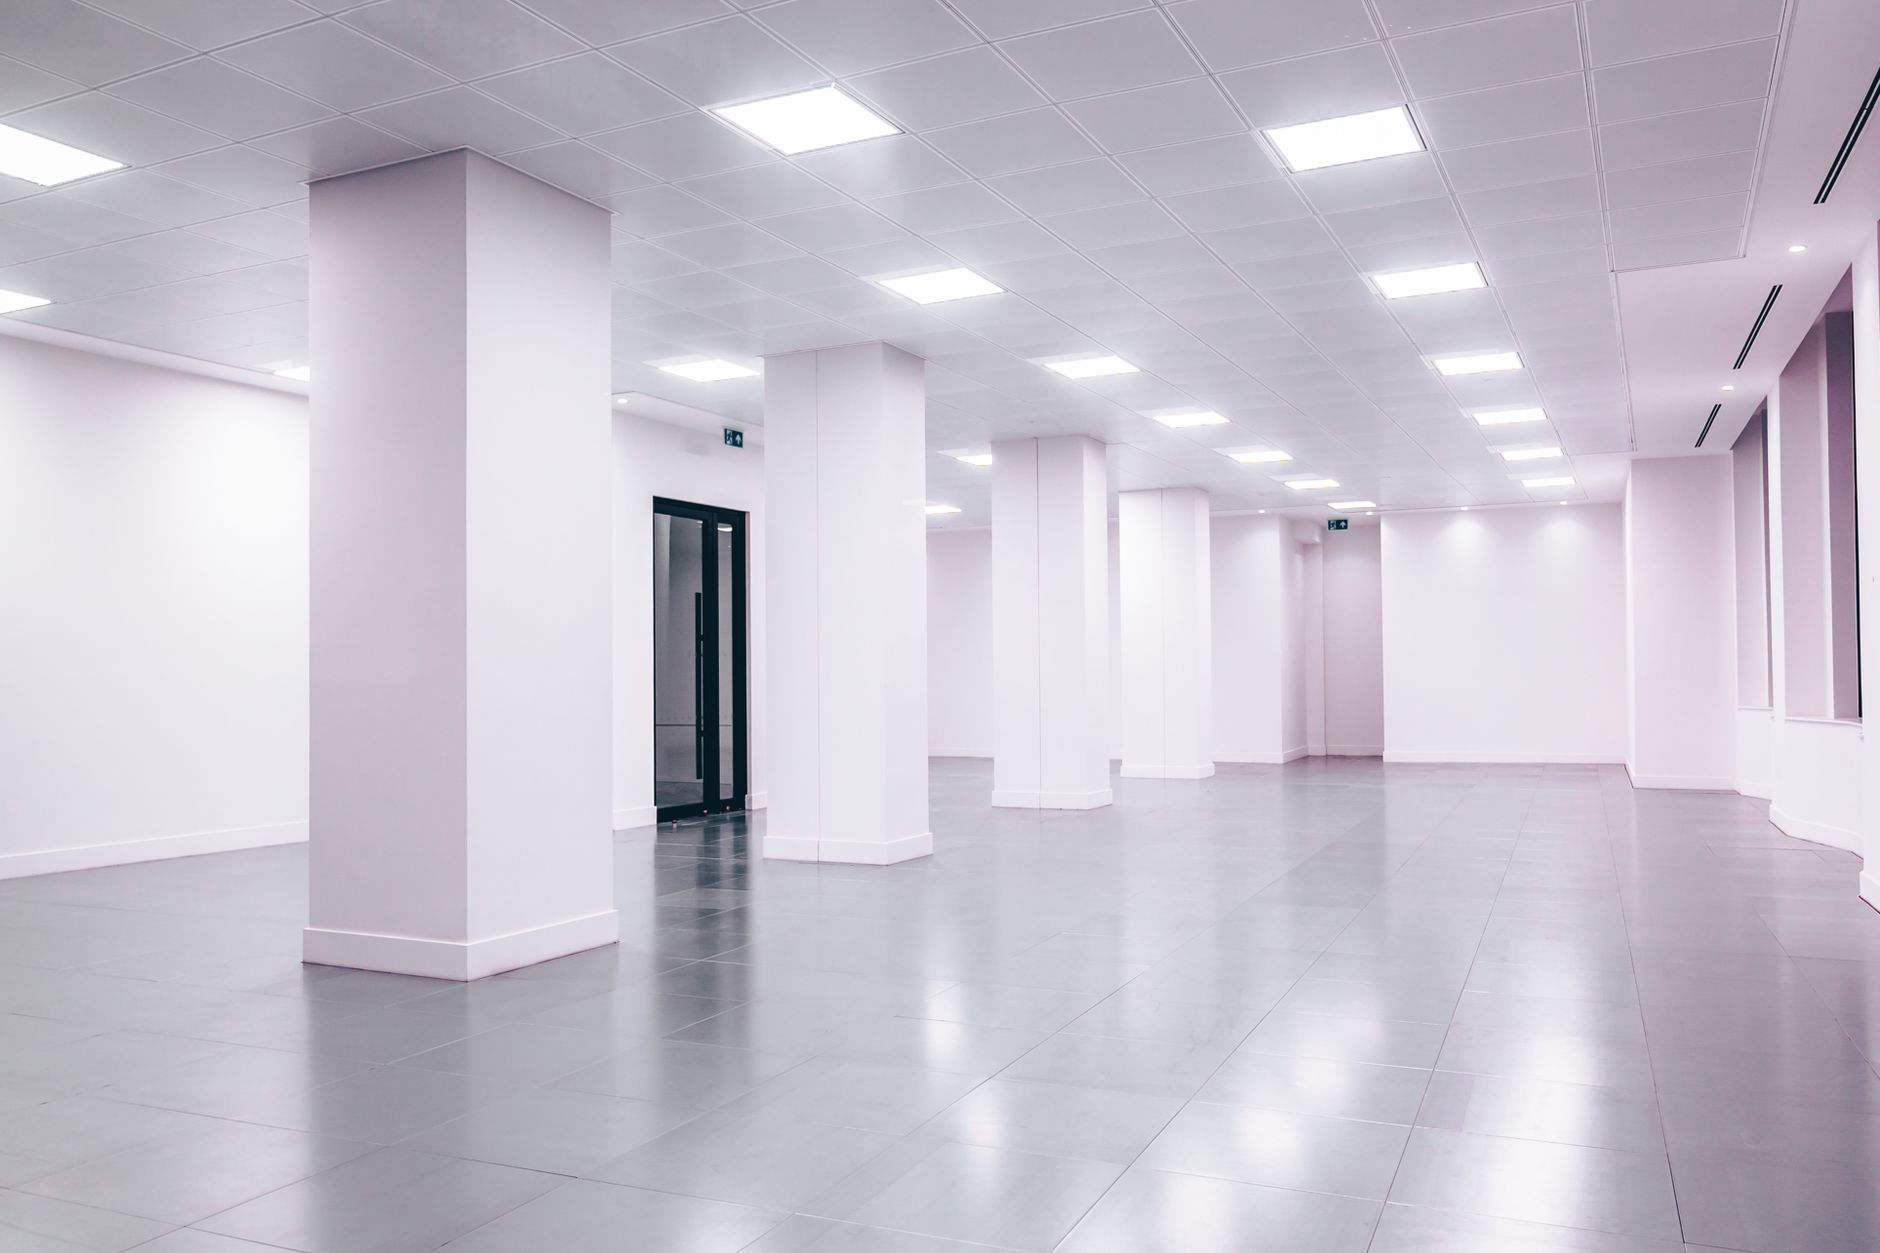
Cleaning robots do their best work on large hard floors with fixed routes. The areas below are where a robot typically runs and where the return is usually found. Each zone is worth checking against your floor plan, because the same building can have several zones with very different coverage.
Carpet, thresholds, stairs, steep ramps and cluttered back rooms limit the route without layout changes. Those areas usually stay with the crew, or they are fixed before a route is set. The site assessment shows which of your zones fit and which need work first.
How does the ROI math work, step by step?
Start with the labor side. Take the hours per week the crew spends on floor routes a robot can run, and multiply by the local wage for this job from the government wage data on this page. That gives the value of the hours a robot could offset. Then reduce that value to the share the robot realistically covers, because the people still do the work the robot cannot.
Next subtract what the robot does not remove: the lease cost, the daily route check, the morning report, remapping after layout changes, and hand work the robot cannot do. What is left over a year is the savings range. The range is used on purpose, since each input moves the result, and a national average would miss the floor that matters.
A simple test helps. If the share of routine floor hours is small, the range will be narrow and may sit close to zero. If the share is large and the floor is open, the range widens. Either way the math should be rerun on your own inputs before a decision, not on a headline figure.
- Night coverage
Cleaning Robot
Runs a fixed route on schedule, including when the building is empty
Staff
Covers the route within a shift and can change the plan at short notice
- Speed on open hard floor
Cleaning Robot
Under two hours of machine time per 10,000 square feet at the benchmark
Staff
About six hours per 10,000 square feet at the manual mopping benchmark
- Clutter and layout changes
Cleaning Robot
Needs remapping after changes and slows around racking and obstacles
Staff
Adapts to clutter and new obstacles on the spot
- Spills, detail and restrooms
Cleaning Robot
Does not handle spills, detail work or restrooms
Staff
Handles spills, detail work and restrooms
- Judgment on unusual conditions
Cleaning Robot
Stops or reroutes around obstacles and flags what it cannot pass
Staff
Makes calls on unusual conditions and reports them
- Cost structure
Cleaning Robot
Fixed lease payment plus check and report time
Staff
Labor hours that scale with shifts and the local wage for this job
What changes the number up or down?
The biggest swing is the share of floor hours that are open and repeatable. A large, open hard floor with few obstacles scores high. A cluttered floor with many thresholds scores low, even when the square footage looks similar on a floor plan. The second swing is when the robot runs. If it works while the building is empty, the crew can be reassigned, and the hours offset is easier to capture.
The third swing is how the crew is scheduled. If the crew already runs short, the first benefit may show up as steadier coverage rather than fewer hours, which changes how the return looks on paper. Settle that before the assessment so everyone who signs off reads the range the same way. The checklist below lists what to check before the decision.
What are the risks to the return, and how do you avoid them?
The most common mistake is counting the whole job. A robot takes the routes it can run, so if the plan assumes the crew leaves the floor entirely, the savings range is overstated. Keep trained staff for the work that stays, and build the crew plan around the remaining hours rather than the old headcount.
Setup and mapping take time at the start. Layout changes, new stock locations and seasonal clutter can each require remapping. Plan for that time, assign one person to own the route, and fix floors the robot cannot cross before go live, not during the first week.
Downtime is the second risk. A stopped unit on a night run can leave a floor partly cleaned, so the lease should cover repair, spare unit coverage and a dispatch path. Our service plan covers repair, remote triage and on-site dispatch nationwide, with spare unit coverage for longer repairs, so a fault on one unit does not have to leave the floor uncleaned while it is fixed.
What is the realistic timeline from assessment to payback?
Expect the work to run in phases. The site assessment and mapping come first, then the quote, the lease paperwork, installation and a short run in which the route is tuned. Payback depends on the savings range, and the quote should state the months that range implies. Timelines vary with building size, route count and how quickly the layout settles, so treat any single month count as a planning estimate until the hours are confirmed.
The early months carry the most setup and oversight time, so realized savings usually trail the steady state. A pilot on one route or one unit lets you check the coverage rate and the hours offset before committing more of the building. Go live support and staff training belong in the first weeks, planned in advance rather than added after a problem appears.
How do you get a precise figure from a free site assessment?
A free site assessment turns the range into a figure you can sign off on. We measure the open hard floor, mark obstacles and thresholds, check floor types, and record the crew's hours on each route from timesheets. We also confirm shift times and access, then plan the routes and estimate coverage and run time. The inputs stay written out, so you can change any one of them and see the effect.
We pick the robot for your floor, lease it through financing, deploy and integrate it, train your staff, and service it nationwide. The lease is quoted after the site assessment, so the fixed payment reflects your building rather than an average. Ask for the savings range with its inputs, not just the headline figure.
Frequently asked questions
Put a robot to work in Indianapolis.
We walk your site, learn the job, and recommend the unit that fits. Then we quote the lease, deploy it, and keep it serviced.
Sources
- US Bureau of Labor Statistics, Occupational Employment and Wage Statistics (OEWS May 2024)
- BLS Occupational Outlook Handbook, janitors and building cleaners
- BLS injury and illness snapshot, janitors and cleaners, 2016 to 2020
- BLS injury and illness snapshot, janitors, 2015 to 2019
- AACEM and ISSA autonomous cleaning survey, 2019
- BSM Magazine, US leads in adoption of robotics tech
- ISSA-based sample cleaning times report, 2009 benchmark
- Online warehouse cleaning calculator