
The short answer
Cleaning robot ROI in Knoxville, TN comes from the janitor and building cleaner hours a robot takes over on repetitive floor passes, offset by the lease cost and by the share of the work it can realistically cover. Our calculator shows a savings range for your building, and that range moves with floor area, shift length and how much of the cleaning follows a fixed route. A lease cost is quoted only after a free site assessment, so the range can be checked against measured facts before anyone commits.
Key takeaways
- The return comes from janitor and building cleaner hours the robot takes over, not from a headcount cut on paper.
- The savings range depends on floor layout, shift length and the share of work that follows a fixed route.
- No verified Knoxville payback figure was published, so the site assessment sets the number for your building.
- Injury rates for janitors and building cleaners run well above the all-occupation rate, which adds a safety case.
- A lease quote follows a free site assessment and lists what service is included.
Run the numbers for your site
Auto-detected from your location - we use the real BLS wage here. Not right? Pick your city or state above.
What do you want to automate?
The robot runs the open floor overnight; your crew keeps detail and edges.
How much return can a cleaning robot deliver in Knoxville?
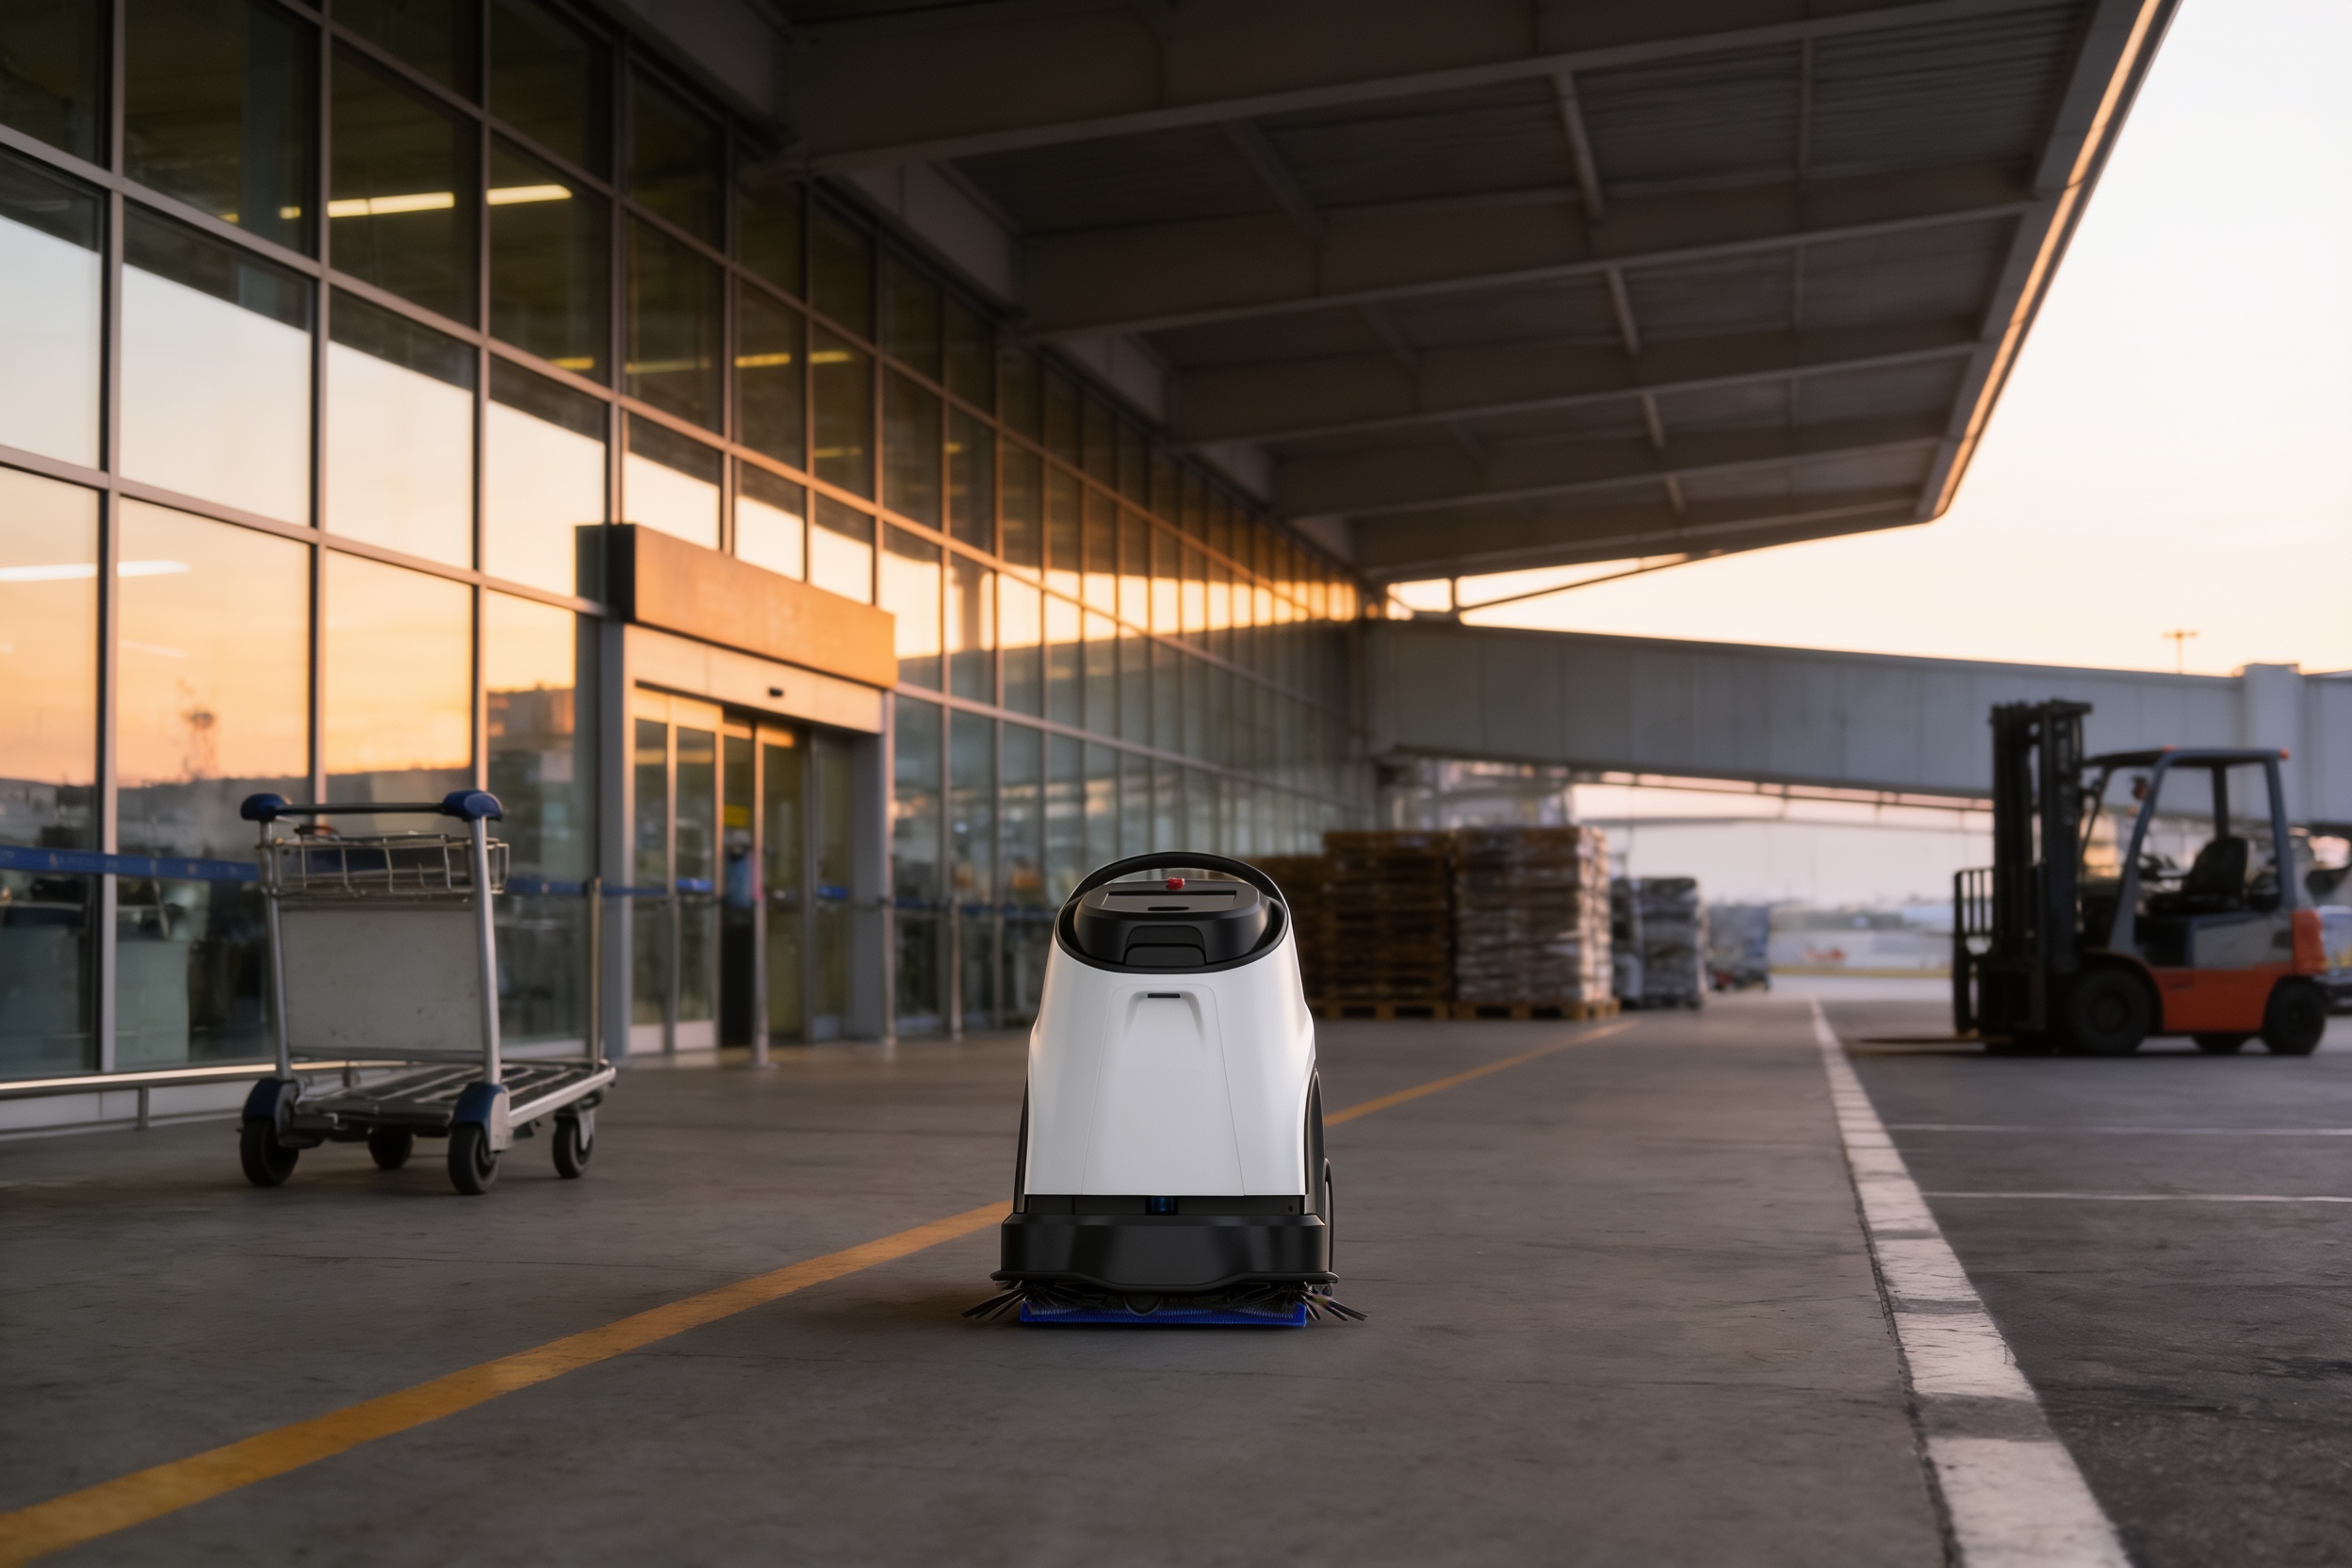
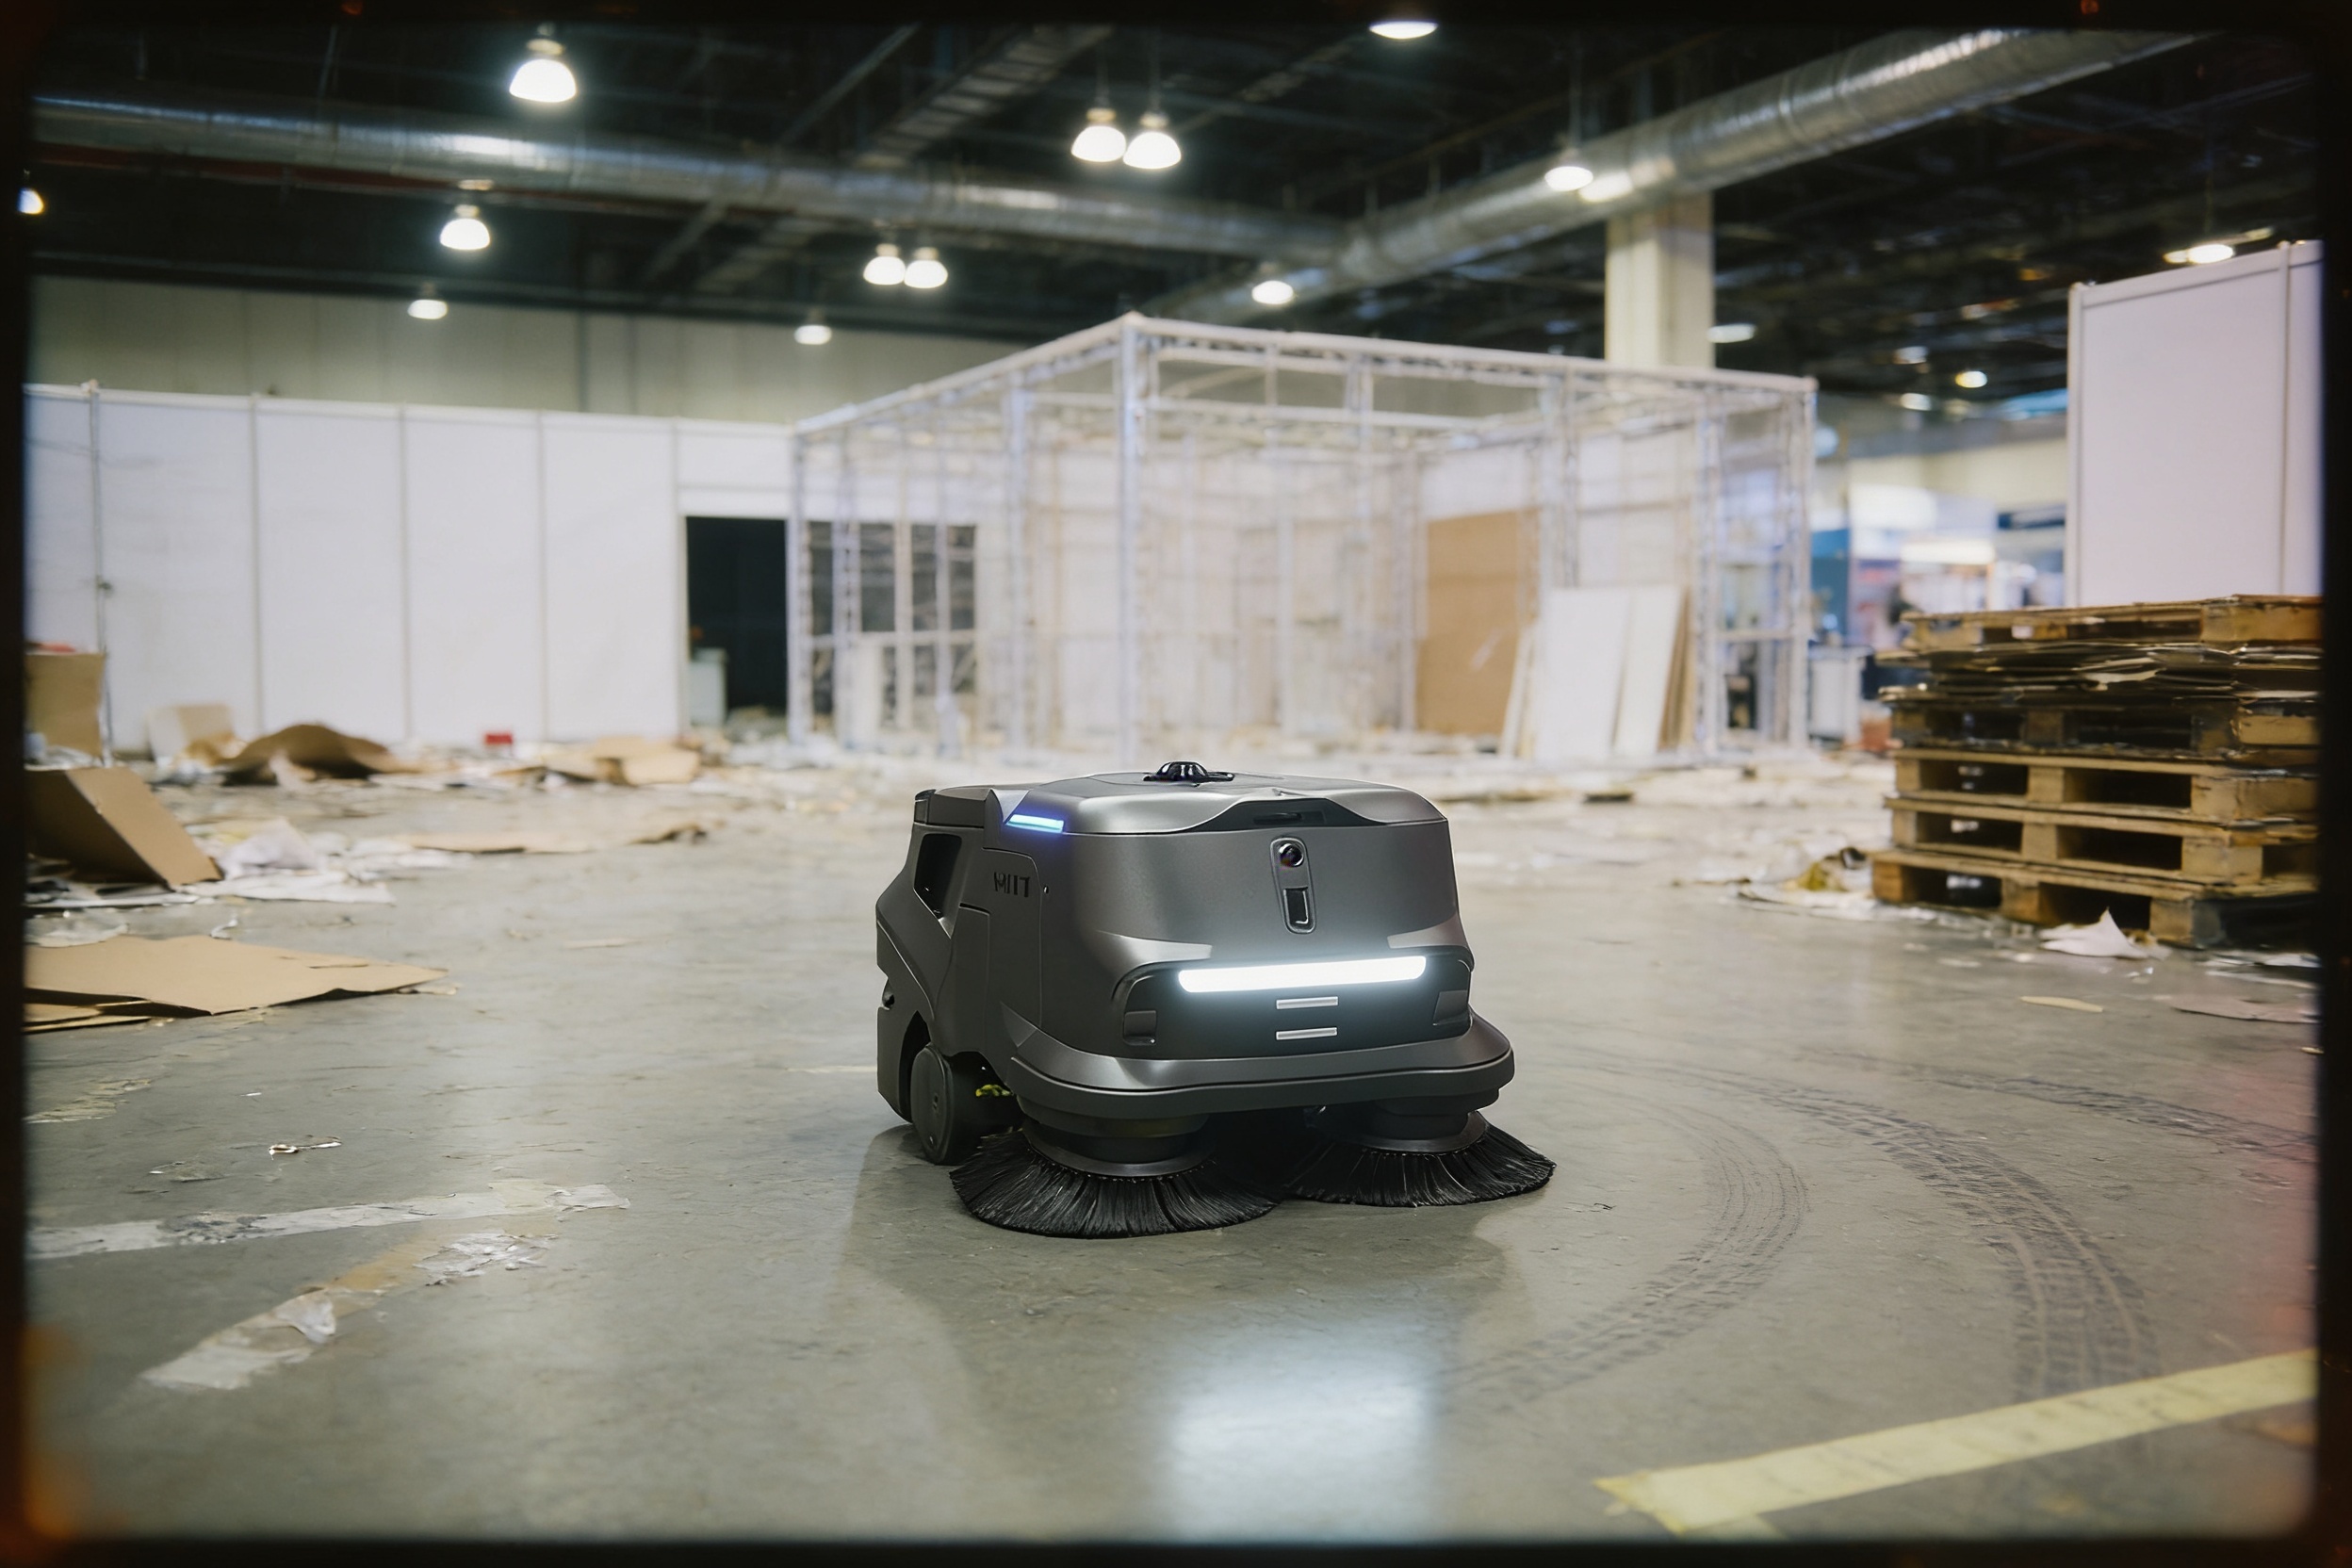
Cleaning robot ROI in Knoxville, TN is mostly a question about hours. An autonomous floor scrubber or sweeper runs a fixed route without an operator, and it takes over passes that janitors and building cleaners would otherwise walk or push by hand. The return depends on how many of those passes your building has, how often they repeat, and what the lease costs over the term you choose.
We will not give a payback date from this page, because we did not find a published payback figure for Knoxville or comparable buildings that we could verify. What this page gives you is the method, the local context from government sources, and a calculator pre-filled for this city. Its output is a savings range, not a promise, and it only becomes specific after a site assessment measures your floor.
The sections below cover who does this work locally, where the hours come from, how the math runs, what moves the range up or down, the risks to the return, and the timeline from assessment to payback. Read them as a guide to the numbers you will need to check for your own building.
Who does this work in Knoxville?

Janitors and building cleaners held about 2.4 million jobs in 2024, according to the BLS Occupational Outlook Handbook, and that source projects growth of 2 percent from 2024 to 2034, slower than the average for all occupations. Slow projected growth means the labor pool is not expanding quickly, so an operator cannot count on the pool growing to cover a larger building.
Local figures are thinner. The BLS Knoxville metro occupational release from July 2024 reported 3,087 establishments and a 59 percent response rate, but its occupational table covers production jobs, not janitors, and the reference period is not clear from the release. The government wage data panel on this page is the local figure to use for the labor side, and the calculator runs on it.
Turnover is harder to pin down. The handbook's older edition projected about 350,300 openings a year for this job, including growth and replacement, which is a rough proxy for churn rather than a turnover rate. We did not find a verified turnover rate for janitors and building cleaners, so this page does not state one, and the site assessment should ask your own team for their numbers.
Median hourly wage, Janitors and Building Cleaners
$3,313
Monthly cost of one full-time worker in Knoxville, TN, at the median wage plus payroll costs (an estimate, not a quote).
Where does the return come from?
The return is the time that janitors and building cleaners spend on floor work the robot can repeat on its own, valued at the local wage for this job. That work is mostly repetitive: the same corridors, aisles or open floor, on a schedule that repeats every shift. A fixed-route machine handles that pattern well, while spot cleaning, restrooms, moving furniture and anything that needs judgment stay with people.
The offset is smaller than the whole shift. A robot usually takes the floor passes, and staff still do setup, checks, spills and the areas the machine cannot reach. For planning we assume a crew of about three janitors or building cleaners per site. That is our working assumption, not a published count, so the saving is the share of those hours that are fixed-route floor work.
The table below shows how the split works, task by task. It does not give hour counts, because no published per-site hours figure for this job was found. The site assessment measures the split for your building, and the calculator uses those measured hours in place of any estimate.

How does the math work?
The calculator starts with the local wage for this job, the floor area, the number of shifts, and the hours of fixed-route floor work the robot can take over. It then subtracts the lease cost for the term you select and any service or training costs the quote includes. The result is shown as a range, because each input carries a band of uncertainty.
The range is most sensitive to the share of work the robot realistically takes. A building with long open aisles and a set route will show a higher share than one with many small rooms, stops and furniture, so the calculator asks for layout details rather than assuming a share. Assuming a high share that the layout cannot support is one of the easiest ways for a range to come out too high.
Lease cost is quoted after the site assessment, and it depends on the machine, the term, and the service plan. Ask whether maintenance included covers scheduled upkeep, repairs and dispatch, and get the answer in writing. Keep the labor side and the cost side on the same basis, or the result will look better than the site supports.
What changes the number up or down?
Two buildings of similar size can produce very different ranges with the same robot. The factors in the checklist move the result most often, so check them before accepting any range, including ours.
Use the checklist to see which inputs are solid and which are guesses. Inputs you can measure, like floor area and route length, are worth measuring before the assessment. Inputs you can only estimate, like future staffing, should be shown as a band rather than a single number.
What are the risks to the return, and how do you avoid them?
The biggest risk is counting hours the robot will not really take. If the layout changes, the route breaks, or staff keep doing the same passes out of habit, the saving shrinks while the lease cost stays fixed. Build the route with the site team and review the hours taken over at set intervals.
The second risk is downtime. A machine out of service does not clean, and the work falls back on staff who may already be stretched. A service plan with on-site dispatch, remote triage and a spare unit option limits how long a fault holds up the floor, so ask how the quote handles response time and loaner units.
Peer adoption is useful context, not proof. An ISSA and AACEM survey from 2019, with nearly 23,000 respondents, found 27 percent were active users of autonomous cleaning equipment, and about one-third of non-adopters said they were somewhat likely to adopt within a year. That survey is dated, so treat it as a sense of direction rather than a present benchmark.
Is the work safe, and what do the injury rates show?
Janitorial work carries a heavy injury burden. The BLS injury and illness snapshot for janitors and cleaners, based on 2019 data, counted 18,680 nonfatal cases with days away from work, with an incidence rate of 157.4 per 10,000 full-time workers, against 86.9 for all occupations. The same snapshot lists 178.6 for 2016 and 176.6 for 2017.
Those occupation figures count days-away cases only, so they are not directly comparable to the all-private rate that BLS published for 2023: 2.2 cases per 100 full-time equivalent workers, down from 2.3 in 2022. Read them as two separate measures. For this page, the point is that repetitive floor work is one part of the job a robot can take over, which is the safety case to place beside the cost case.
We did not find a 2023 or 2024 injury rate specific to this occupation, so the most recent occupation figure here is from 2019. Check the safety case against your own incident log and the ratings your insurer applies, not against national numbers alone.
How long does it take to go from assessment to payback?

A typical path starts with a free site assessment, where we map the floor, measure routes and obstacles, and identify the zones and hours the robot would take over. The lease quote follows that assessment. Deployment and integration come next, then staff training, then a go-live period in which the route and schedule are tuned against real runs.
Payback begins only after setup. Time spent on assessment, deployment and training comes before any hours are offset, so the first weeks usually show cost rather than savings. The calculator can show when the range crosses break-even under the inputs you enter, which is more useful than a single date that cannot be checked.
A pilot with one leased unit is a practical way to test the share of work the robot really takes before committing to more machines. Track the hours it covers over a set period and compare them with the assessment estimate. If the measured share matches the estimate, the range can be trusted for a wider rollout.
How do you get a precise figure from a free site assessment?
A precise figure needs your floor plan, your shift schedule, your cleaning routes as they run today, and the labor inputs you use internally. Bring those to the assessment along with the lease term you want to consider, and the calculator will produce a savings range for your building rather than for the city as a whole.
We are a US commercial robot integrator. We pick the robot for the site, lease it through financing, deploy and integrate it, train the staff and service it nationwide. Keeping the fit, the lease and the upkeep with one team means the range and the quote rest on the same site facts.
The lease quote follows the assessment and lists the terms in writing, including what service it covers. If the numbers do not work for your building, the assessment should say so. Ask for the range, the inputs behind it and the conditions that would move it up or down.
Frequently asked questions
Put a robot to work in Knoxville.
We walk your site, learn the job, and recommend the unit that fits. Then we quote the lease, deploy it, and keep it serviced.
Sources
- US Bureau of Labor Statistics, Occupational Employment and Wage Statistics (OEWS May 2024)
- BLS Occupational Outlook Handbook, Janitors and Building Cleaners
- BLS Knoxville metro occupational employment and wages release, July 2024
- BLS injury and illness snapshot, janitors and cleaners, 2016 to 2020
- BLS workplace injuries and illnesses news release, 2023 data
- ISSA and AACEM autonomous cleaning survey, 2019