
The short answer
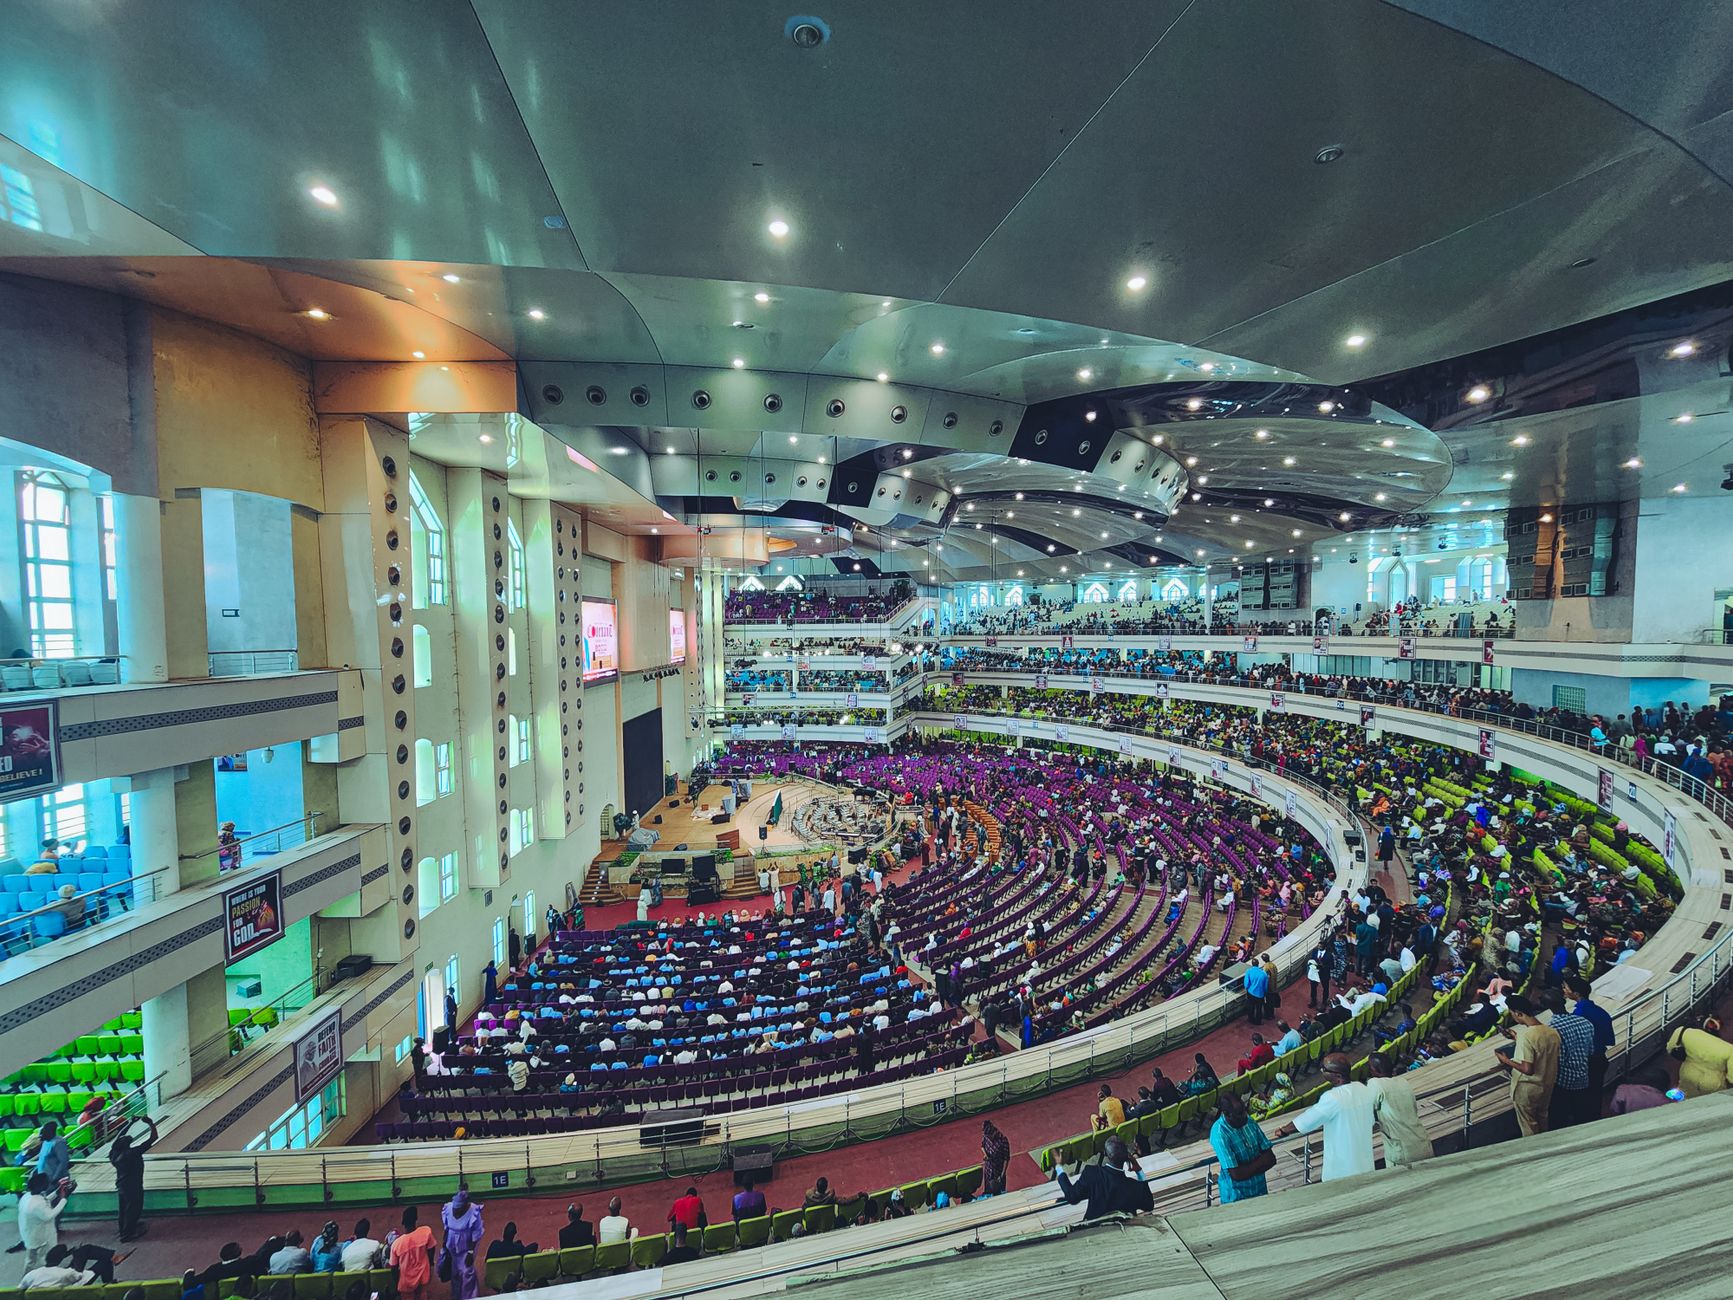
A delivery robot returns labor at a convention center by taking repeated runs of food, supplies and bins between halls and back-of-house areas on set routes, which is waiter and waitress type work that staff otherwise walk by hand on event days. Delivery robot ROI for convention centers depends on how many of those runs the robot realistically covers, the lease cost, and how well the routes fit the building. Savings appear as a range on this page, and a precise figure comes from a free site assessment.
Key takeaways
- The return comes from runs the robot takes over, not from cutting the team.
- Savings are priced on waiter and waitress type hours, so only that share of work counts.
- Event calendars with long gaps between sessions make the return easier to capture.
- Routes, elevators and dock access decide how much of the day the robot can cover.
- A free site assessment turns the range on this page into a lease quote for your building.
Run the numbers for your site
Pick your city or state for a real regional number - we use the real BLS wage there. (On the live site this auto-detects from your location.)
What do you want to automate?
The robot walks the repetitive trays; staff stay with guests and tables.
Delivery robot ROI for convention centers: where the return comes from
The return on a delivery robot at a convention center comes from one place: runs. Food, plates, linens, signage and supply bins move between exhibition halls, the kitchen, loading docks and staging rooms many times across a day, and most of those trips are done by staff on foot or with carts. A robot that takes a share of those trips on set routes returns the hours staff would otherwise spend walking them.
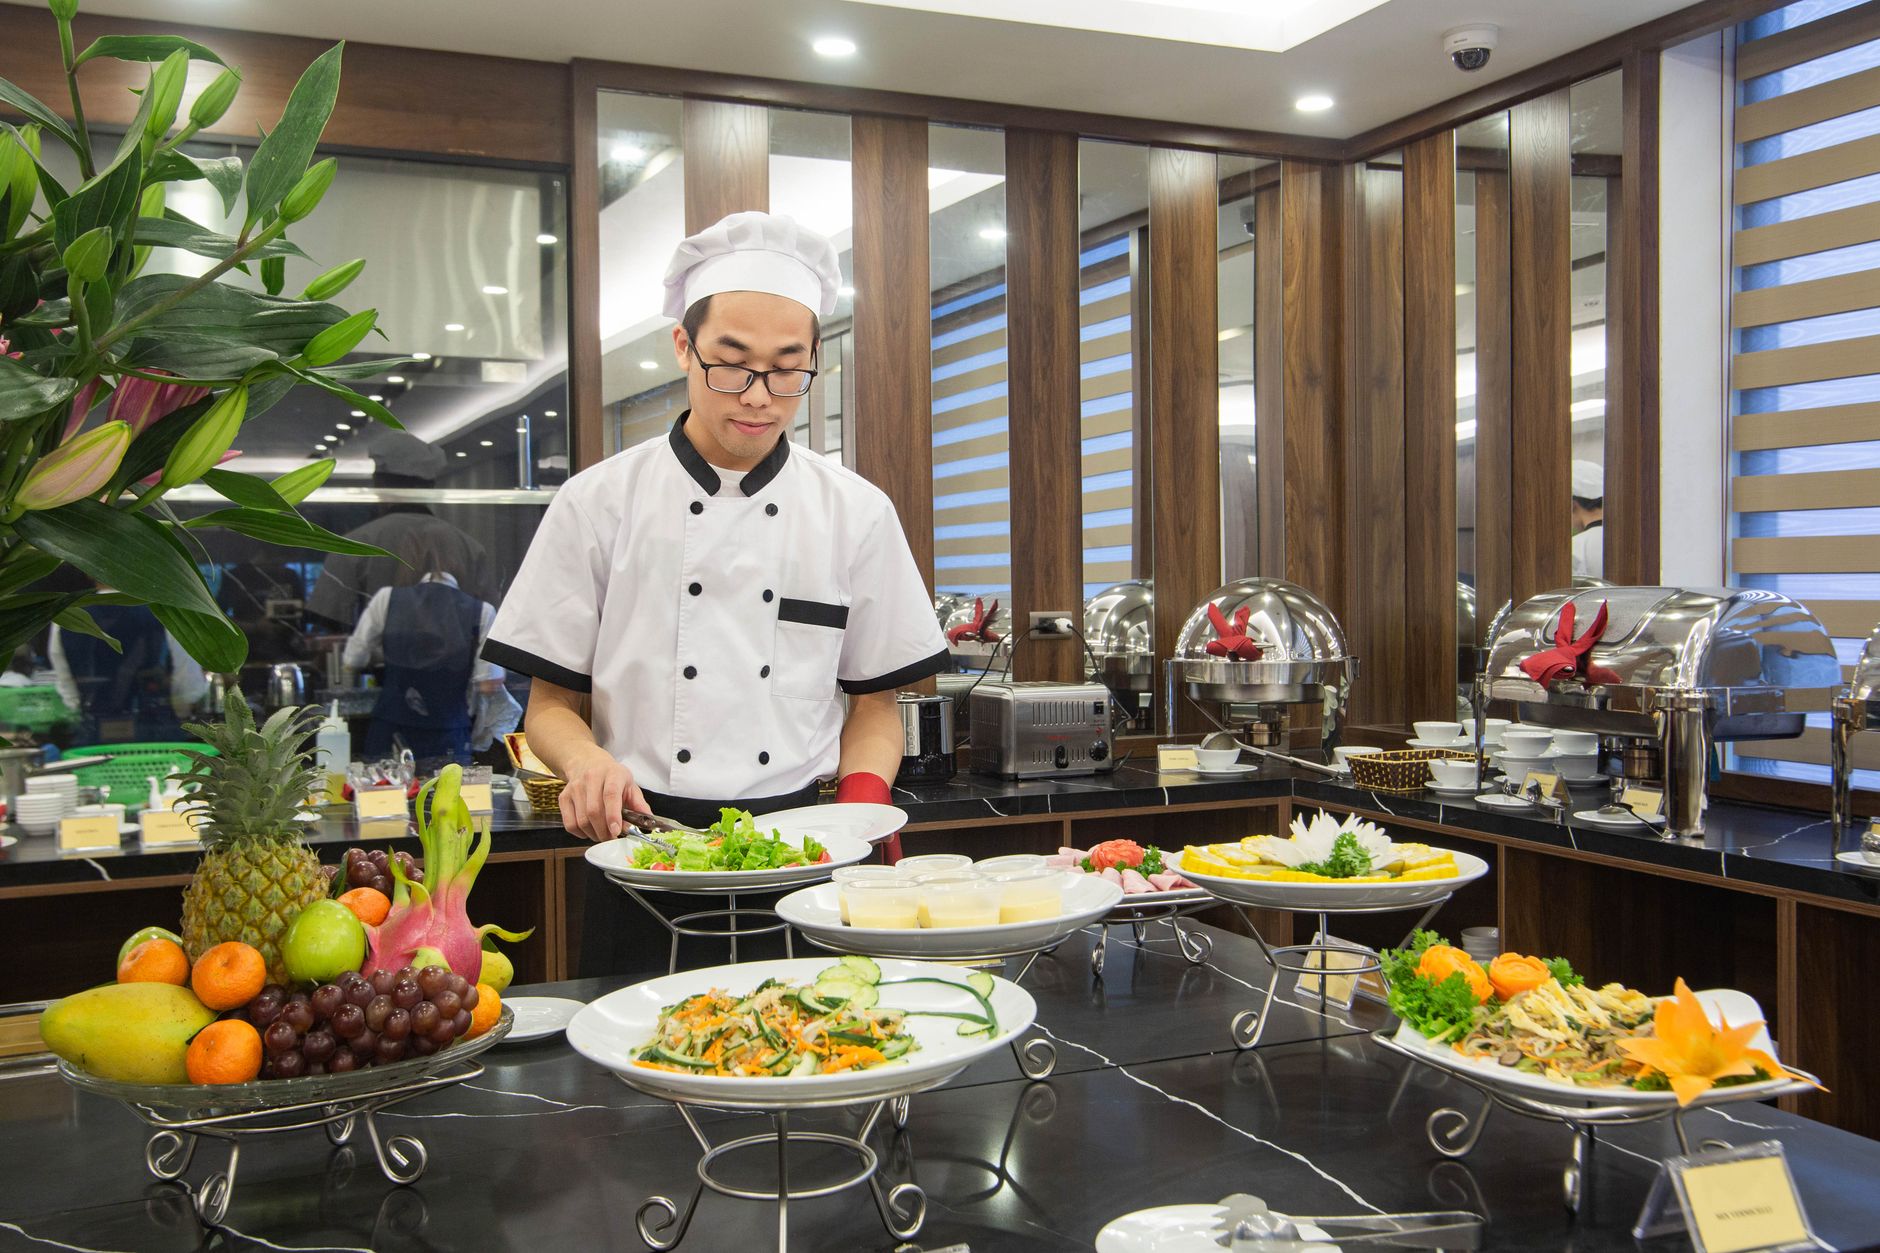
Delivery robot ROI for convention centers is a labor offset, not a reduction of the team. Staff still load, unload, set up, guide guests and handle exceptions. What changes is how much of the walking and repeated carrying lands on people. For this page, the labor side is priced on the hours of waiter and waitress type work the robot takes over, because that is the closest government occupation to the food running done in this setting.
Expect a return that is real but uneven. It is strongest on large event days with gaps between sessions and weakest on days with few movements. The calculator on this page shows a savings range, and that range moves with the inputs described below.
How many convention centers are there and how much work do they carry?
No recent national count of U.S. convention centers or total exhibition floor space was found in our research, so any headline count would be a guess. The most recent state-level snapshot we found is a 2017 count from an online statistics database, which listed 20 facilities combined in California, Florida and Nevada. That shows how activity concentrates, but it is too old to size the market today.
The Events Industry Council, working with Oxford Economics, published its 2026 Global Economic Significance of Business Events in May 2026 using 2025 figures. It reports 9.7 million direct jobs and 24.2 million total jobs supported worldwide. Those are global totals rather than a convention-center count, but they show the size of the workforce behind every event.
Venue-level reporting shows how much activity one building can carry. Boise Centre in Idaho reported 170,812 attendees across 278 events in fiscal 2025, according to its own economic impact release. Event count matters more than attendance for this page, because each event means setup, turnover and teardown, and each phase produces its own movement of supplies and food.
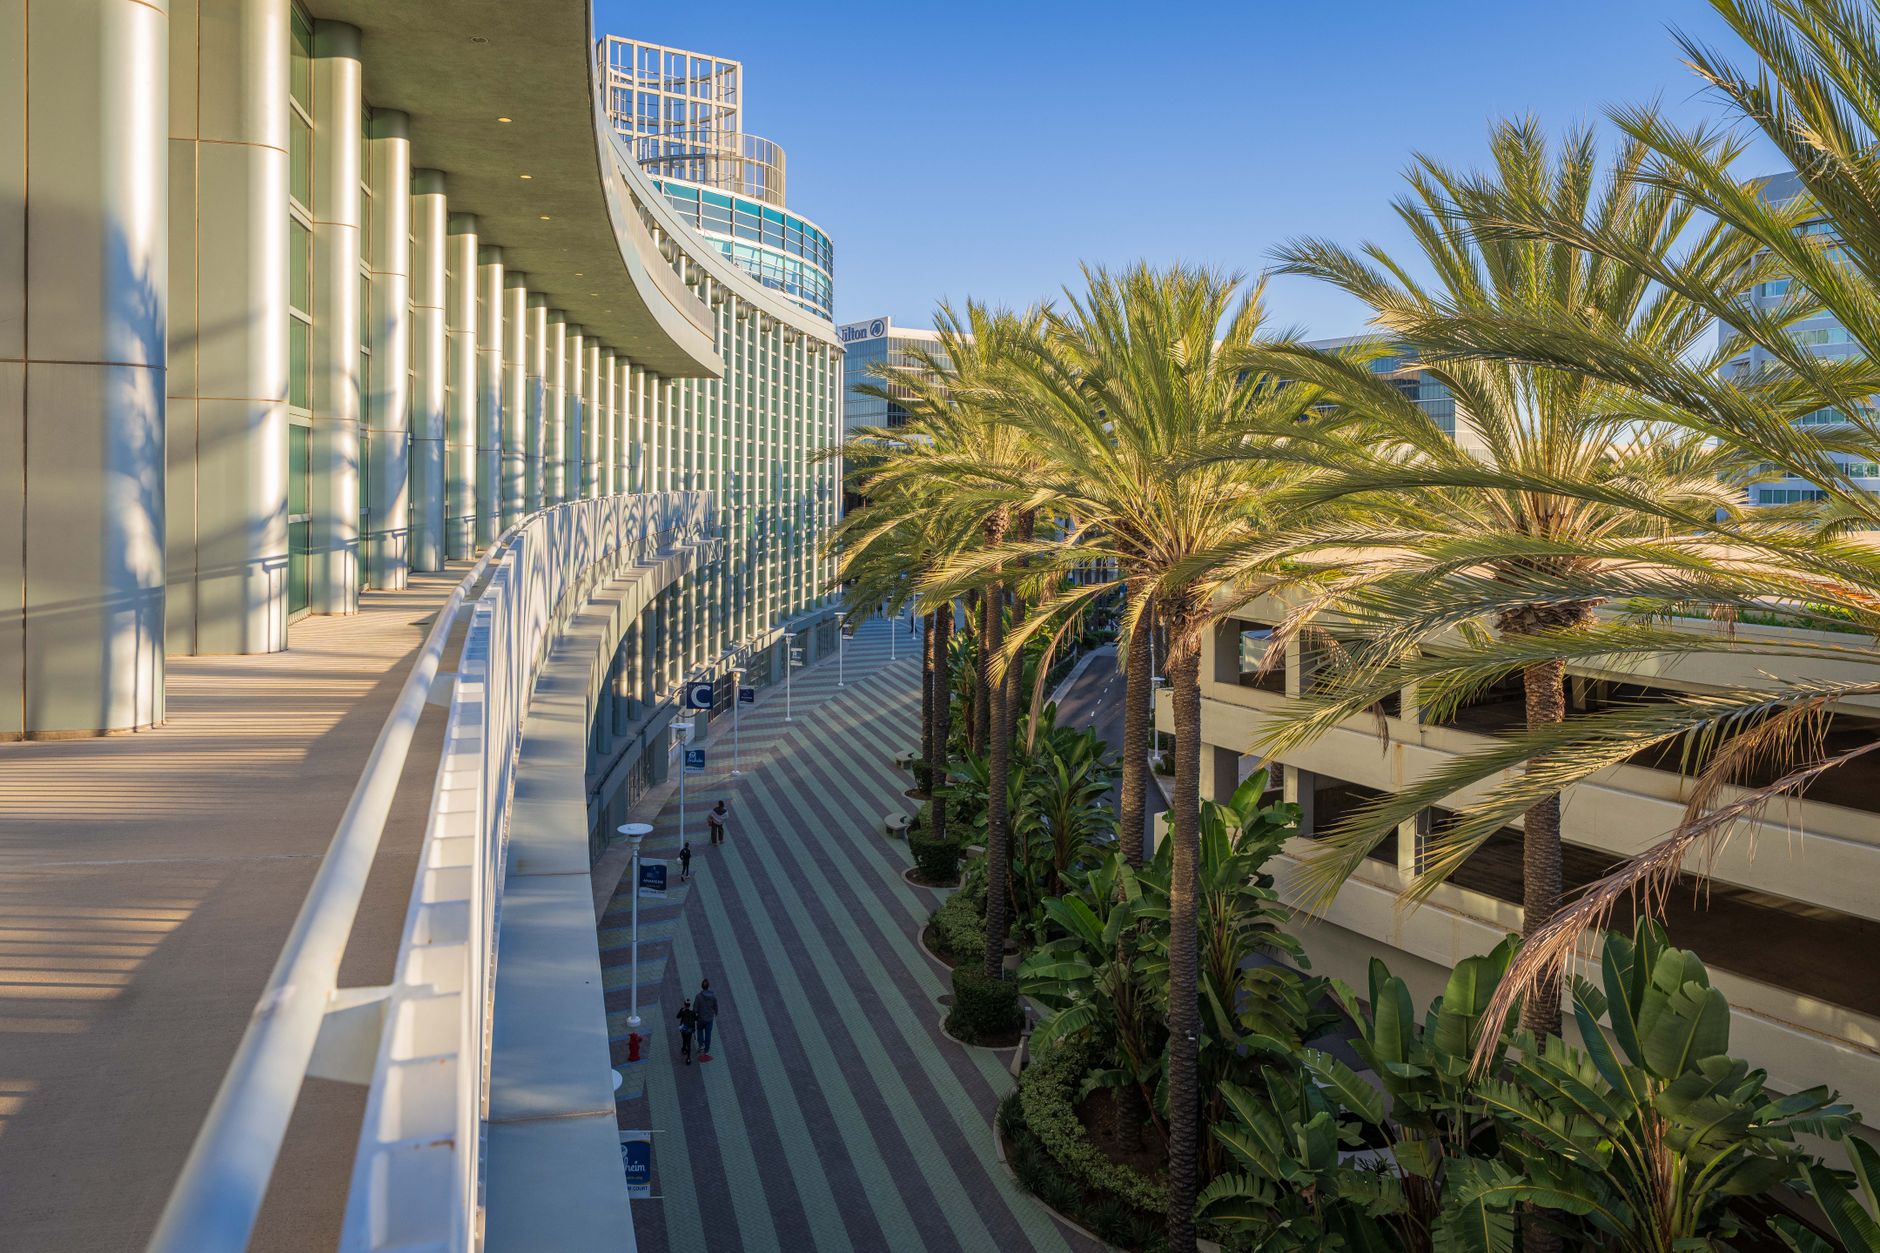
A typical site is made of several zones with different traffic. The zones below are where the robot works, and they are the places to map during the site assessment.
Median hourly wage, Waiters and Waitresses
$3,798
Monthly cost of one full-time worker, at the median wage plus payroll costs (an estimate, not a quote).
Who does the food running now, and how hard is it to staff?
In federal data, the work of carrying food and supplies is closest to waiters and waitresses. The Bureau of Labor Statistics Occupational Outlook Handbook counts about 2,329,700 jobs in that occupation in 2024 and projects employment to fall 1 percent from 2024 to 2034. A projected decline in employment does not mean fewer openings, because most openings come from workers leaving the occupation. Staffing pressure tends to come from turnover more than from the headcount trend.
Turnover is the bigger issue. A secondary restaurant industry blog, RestroWorks, put average employee turnover at roughly 75 percent for 2025, and it reported quick-service turnover above that level. Those figures do not come from the federal data, so treat them as directional. Even so, they describe the problem every event manager knows: new people, new routes and training on every shift.
Food service managers do a different job. The Occupational Outlook Handbook counts about 352,800 of them in 2024, projected to grow 6 percent from 2024 to 2034, with about 42,000 openings a year. A robot does not take the managers' work of planning, staffing and approving menus, so the calculator does not price that time.
Physical strain is part of the picture. The Bureau of Labor Statistics reported 2.3 total recordable cases per 100 full-time-equivalent workers in private industry in 2024, down from 2.4 in 2023. That rate covers all of private industry, not convention centers. A 2019 federal analysis of full-service restaurants recorded 88.3 days-away-from-work cases per 10,000 full-time workers. That figure is older and does not isolate causes, so it is context, not a benchmark for your site.
Taken together, these figures describe a labor pool that is shrinking in count, turning over quickly and exposed to repetitive walking and lifting. None of them is specific to convention centers. The site assessment should replace these national patterns with the staffing history of your own venue.
How does the savings math work for a delivery robot?
The calculator uses four inputs. The first is the number of waiter and waitress type hours the robot can take on a typical event day, which comes from the routes and loads measured during the site assessment. The second is the share of those hours a robot realistically handles, since some trips need hands, doors or elevators the robot cannot use. The third is the local wage for this job, shown in the government wage data on this page. The fourth is the lease cost, which is set in a quote after the assessment.
The arithmetic is simple to state. Robot hours taken over, multiplied by the local wage for this job, gives the gross labor value. The lease payment comes off that figure, and the result is the net savings for the period. The range comes from running the same calculation on a low and a high estimate of hours and share, rather than on a single guess.
Hours matter more than headcount. A venue with long setups and short event days will show a different range than one that runs food between sessions all day. The table below shows where the hours usually sit, and the calculator uses the figures your site assessment confirms.
The lease payment is quoted as a fixed robot lease payment after the assessment, so the savings range is widest where hours are least certain. A site with a short, well measured route narrows the range quickly. A site where the calendar changes every month keeps the range wide until several event cycles are logged.
| Task | Today | With a robot |
|---|---|---|
| Carry supply bins from the loading dock to an exhibition hall | Staff walk each load, timed to the event schedule | Robot runs the mapped route, staff load at the dock |
| Move plated food from the kitchen to a hall between sessions | Staff carry trays on foot or by cart during service peaks | Robot takes scheduled runs, staff plate and hand off |
| Return empty bins and soiled linens to back-of-house | Staff collect and walk returns after each session | Robot returns bins on the route, staff sort and clean |
| Restock staging rooms before a banquet | Staff make repeated trips with carts | Robot makes scheduled restock runs, staff verify counts |
| Set up and tear down tables and chairs | Staff move furniture by hand | No change, the robot does not take this work |
Hour figures come from the site assessment, measured on a typical event day. This page does not publish verified hour counts for food running, so the table shows the work by task rather than by time.
Which work can a delivery robot take, and what stays with staff?
A delivery robot is good at repeated movement on a known route. It handles bins, insulated carriers and supply cases between halls, a kitchen, a loading dock and a staging room, provided the route is mapped and the floors and doors allow it. It is less useful for work that needs judgment, such as deciding what a guest wants, resetting a banquet table or dealing with a spill.
Plan for the robot to take a share of the trips, not all of them. Some runs go to rooms without a usable route, some loads are too heavy or awkward for the carrier, and some trips happen at moments when a person has to be present. The share is measured on site, and it is the variable that most often separates a good estimate from a poor one.
Loads also need attention. Food and linens need covers, and the carrier must be cleaned between uses, so the handoff routine should include a sanitizing step that a person completes. Count that step in the hours, because it is part of the work staff keep.
The comparison below is written to be honest about where people do better.
- Repeated runs on a known route
Delivery Robot
Follows the same path and schedule on every trip
Staff
Slower, but adapts when a route changes or a crowd forms
- Hands-on setup and teardown
Delivery Robot
Cannot move furniture or set tables
Staff
Does this work, and clearly does it better
- Guest interaction
Delivery Robot
No guest service role
Staff
Answers questions and handles complaints
- Handling exceptions
Delivery Robot
Waits or stops when blocked and needs a person to clear the path
Staff
Reroutes and solves the problem on the spot
- Doors and elevators
Delivery Robot
Works only where the route is mapped and access is allowed
Staff
Goes anywhere a person can go
- Consistency late in a long shift
Delivery Robot
Same speed at the end of the day
Staff
Speed and accuracy fall as fatigue builds
- Training new staff
Delivery Robot
Route is set once, staff learn the handoff
Staff
Each new hire needs training on every task
- Cost basis
Delivery Robot
Lease cost set in a quote
Staff
Local wage for this job, plus turnover and training time
What changes the number up or down?
Three things move the return most: the event calendar, the route quality and the handoff process. Long gaps between sessions give the robot time to run, while back-to-back sessions crowd the schedule. Clean routes with level floors, usable elevators and clear doors raise the share the robot can take. Habits at the handoff, such as how fast bins are loaded and where they are left, decide how much idle time the robot spends waiting.
Other items matter less but still shift the range. Peak days in a multi-hall venue create queues at shared doors and elevators, which slows every trip. The number of zones on one route, and whether one unit or several are needed, also changes the range. Our team checks these items during the assessment so the lease quote reflects the building you have.
What are the risks to the return, and how do you avoid them?
The main risk is a robot that sits idle. A unit waiting at a dock or blocked by a crowd produces no offset. Avoid this by mapping the route before deployment, testing it on a real event day with a small load, and setting clear rules for who loads and who clears blockages.
The second risk is that the team never changes its routine. If staff keep walking the same trips, the robot adds cost without offsetting hours. Training for people on the dock and in the kitchen makes the handoff part of the job rather than an extra step. Our integrators train the staff as part of deployment.
The third risk is downtime during a large event. A lease that includes service, on-site dispatch and remote triage reduces the chance that one fault stops the whole route. Ask how quickly a fault is triaged and when a technician arrives, and ask for the service plan in writing before signing.
We lease robots through financing, deploy and integrate them, train the staff and service them nationwide. We choose the unit that fits the site rather than a single model for every venue.
What is a realistic timeline from assessment to payback?

The sequence runs in stages. It starts with a site assessment that maps the halls, docks, elevators and kitchen and measures the runs. A quote follows, with lease terms and the calculated range for your event calendar. Deployment comes next, with route setup, integration with doors and elevators where possible, and training for the team.
Go live is usually staged. Many venues start with one route on a set of event days, review the hours actually taken over, and then widen the routes. Payback is judged against measured hours, not the first estimate, so the first full event cycle is where the real number starts to show.
How long payback takes depends on how many event days fall in the year and how many routes are running. Venues with frequent large events see the offset sooner than venues with a few large shows a year. Our team sets the payback expectation from the quote and the measured run data, and we do not promise a date before those inputs exist.
How do you get a precise figure from a free site assessment?
A free site assessment turns the range on this page into a number for your building. We walk the halls, dock, kitchen and staging rooms, map the routes, count the runs on a typical event day and note the doors, elevators and floors that affect the route. We also ask for the event calendar and the existing staffing pattern.
Bring the information that is quickest to pull: the calendar for the next year, how many banquet and concession events happen in a typical month, the routes staff use today, and any record of incidents or service interruptions. Those inputs let the calculator use your data instead of the defaults.
After the assessment you receive a lease quote, a range built from measured runs, and a deployment plan. The quote states lease terms through financing and includes the service plan. If the numbers do not justify a robot, the assessment will say so, which is also a useful result.
Frequently asked questions
Want a delivery robot at your convention center?
Tell us about your site. We will recommend the robot, quote the lease, and keep it serviced.
Sources
- US Bureau of Labor Statistics, Occupational Employment and Wage Statistics (OEWS May 2024)
- U.S. Bureau of Labor Statistics, Occupational Outlook Handbook: Waiters and Waitresses
- U.S. Bureau of Labor Statistics, Occupational Outlook Handbook: Food Service Managers
- U.S. Bureau of Labor Statistics, Occupational Injuries and Illnesses release
- U.S. Bureau of Labor Statistics, Technology and Employment Data brief on full-service restaurants, 2019
- Statista, states with the largest number of convention centers in the US
- Events Industry Council and Oxford Economics, 2026 Global Economic Significance of Business Events, as reported by Travel Daily News
- Boise Centre, 2025 economic impact release
- RestroWorks, restaurant turnover statistics 2025 (secondary summary)